28 minute read · August 5, 2019
Analyzing historical Azure Stream Analytics data using Dremio
· Dremio Team

Intro
In this tutorial, we are going to show how to use Azure Stream Analytics, Azure Blob Storage, Azure Event Hubs, and Dremio to process and analyze the data. We will build a data pipeline starting from data producer which will be a Python script and then using Dremio, where we will curate the data. Also, we will use the parquet format for storing the data. We will work with the Forest Fires Data Set.
Assumptions
In this tutorial, we assume that you have access to the following tools:
- Dremio 3.2
- Azure account
Brief overview of Azure Stream Analytics, Azure Event Hubs, Azure Blob Storage, and the parquet format
Azure Stream Analytics is an analytics engine available on the Azure platform, which can be used to work with the real-time data (streaming data). It allows to analyze and filter the data, build dashboards, perform ETL workloads with low latency, create event-based alerts, etc. It can efficiently work with many sources and sinks and has a perfect integration with other Azure services.
Azure Event Hubs is a service for real-time data ingestion. If you are familiar with Apache Kafka, then you can think about Azure Event Hubs as about something similar to Apache Kafka. Azure Event Hubs could take the data streams from various data producers and direct them to data consumers (real-time applications and dashboards, for example).
Azure Blob Storage is a well-known cloud storage solution. It allows storing and retrieving different files - binary large objects (BLOBs).
Apache Parquet is a file format for storing data. It is free, open-source, and highly efficient. Its unique peculiarity is that it is column-oriented. This means that, for example, compression techniques are applied column-wise, queries can fetch information from a particular column without reading the entire dataset, different columns can have different encoding, and so on. Initially, the parquet format was developed to use only inside the Apache Hadoop ecosystem. Nevertheless, it becomes very popular and is now used by many other tools.
In this tutorial, we will use all the aforementioned tools to build a data pipeline from a producer towards Dremio. Dremio can curate the data and throw it further, for example, to create machine learning models. There are several tutorials about how to use Dremio to work with data and developed such models. For example, take a look at Building a Machine Learning Classifier with ADLS Gen2 and HDFS using Dremio, Creating a Regression machine learning model using ADLS Gen2 data or Clustering and Analyzing HDFS and Hive Data Using scikit-learn and Dremio.
Creation of the data stream
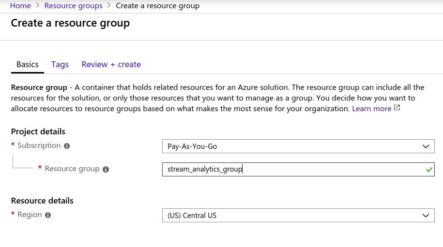
In Azure, you create all resources associated with the particular resource group. Also, it is convenient to logically separate resources dedicated to different projects. For all the work which we will perform in this tutorial, we want to create the resource group with the name stream_analytics_group. So, in the Resource groups section, click the Add button and then fill the form with the information about the subscription, the name of the resource group, and region:

After this, you can click Review+create and then the Create button.
In our streaming pipeline, the data before hitting Dremio will be stored in Azure Blob Storage. Let’s create its instance now. Go to All services → Storage → Storage accounts → Add. Then, fill the form where you should specify the resource group, subscription, the name of the storage account (we selected blobforstream for this tutorial), location, account kind (select BlobStorage). Then press the Review+create button and then the Create button.

To create an Event Hubs instance, you should first create an Event Hubs namespace. We called our namespace dremioingestion. Also, we selected the Basic pricing tier (it should be enough for demonstration purposes, but for the real-world application you may need more advanced tier). Other options should be familiar to you: location, subscription, resource group. The Throughput units is the option for scalability support - the more you select, the more capacity your Event Hubs will have. You can read more about this in the documentation.

Now it’s time to create an Event Hub instance (dremio_event_hub). Go to the created Event Hubs Namespace and click on the + Event Hub button. The following window should appear:

Also, you need to ensure that you have a valid Shared Access Policy for your Event Hub instance. If you visit this section and you don’t see anything there, then you have to create the policy. For example, here is how it looks:


You need to have a primary key or connection string with the primary key to be able to set up the Python script later to send data to the particular instance of the Event Hub. But in most cases, there is a default SAS policy called RootManageSharedAccessKey.
Let’s now focus on the very beginning of our data pipeline, namely, on the Python script. This script should generate events and send them to the Azure Event Hubs. You can think about this script as about the complex real-world application which manipulates with some data and sends information to the processing inside Azure cloud.
To begin with, we import the needed Python packages:
import pandas as pd
import json
import time
from azure.eventhub import EventHubClient, Sender, EventData
We will need Pandas library to load and work with the dataset in the CSV format. JSON is the standard format for transferring information over the network so we should use Python’s json library for encoding and decoding JSON formatted documents. We use the time library to allow short pauses after each event sending.
We have also imported several objects from the azure.eventhub module. These objects are required to connect to the Event Hub instance, form the chunk of the event data and send it. It is worth saying that we had to install this module prior to the usage. It can be done with the help of pip:
pip install azure-eventhub
The next step is to load the dataset and preview it:

Below, we loop over the dataframe and use the pandas dataframe’s method to_json() to convert each row into JSON string. Then, we apply the loads() function from the json package to decode the strings into valid JSON. We save these objects in the jsons list.
jsons = []
for i in df.index:
    jsons.append(json.loads(df.loc[i].to_json()))
The next piece of code specifies the address which will be used in the script to communicate with Azure Event Hubs, as well as the credentials for the latest:
ADDRESS = "amqps://dremioingestion.servicebus.windows.net/dremio_event_hub"
USER = "RootManageSharedAccessKey"
KEY = "your_own_secret_key"
Below, you can see the most interesting part of code, directly responsible for sending events to the Event Hub:
try:
    if not ADDRESS:
        raise ValueError("No EventHubs URL supplied.")
    # Create Event Hubs client
    client = EventHubClient(ADDRESS, debug=False, username=USER, password=KEY)
    # Create sender
    sender = client.add_sender(partition="0")
    # Run the client
    client.run()
    try:
        for i in range(len(df)):
            if i%50 == 0 or i == (len(df)-1):
                print("Sending message: {}".format(i))
            sender.send(EventData(json.dumps(jsons[i])))
            time.sleep(0.01)
    except:
        raise
    finally:
        client.stop()
except KeyboardInterrupt:
    pass
You can see that in order to send an event, we need to create a client using the parameters for address, username, and password. Then, we need to add sender to the client and trigger it. In a loop, we iterate over the jsons list, encode each JSON object into a string, and feed it to the EventData constructor. It creates a chunk of information required to send an event. Then this chunk of information goes to the send() method of the sender. It should send the event to the Azure Event Hub. After each event, we make a pause with the 0.01 seconds duration. After each 50th event or if it is the last event to send, we print the message “Sending message: N”. After all planned events sent, we close the session by calling the stop() method of the client.
We wrote that script, but we shouldn’t execute it right now because there is yet one element in our pipeline which is not ready - the Azure Stream Analytics service. Let’s set up it first.
Working with Azure Stream Analytics
To create the New Stream Analytics job, you should go with this path: All services → Analytics → Stream Analytics jobs → Add. All parameters to fill in should be already familiar to you (job name, subscription, resource group, location). We named our job as stream_analytics_job_dremio. Choose Cloud as the Hosting environment. For demonstration purposes, you can request for only 1 streaming units, but for the real projects, there can be a need to have more. Click Create.

After the job was created, we need to add input and output for the job. This is a very important step because the quality of the final results depends on it. First, go to the Inputs section and click the Add stream input button. In the appeared form, specify several needed parameters. The information required is the alias of the input (inputfromevhub), subscription, Event Hub namespace name (dremioingestion), Event Hub policy name, event serialization format (as we send data in JSON, we should select JSON option here). Then click Save.

Now, it’s time to specify the output. Go to the Outputs section and click the Add button, then choose the Blob storage/Data Lake Storage Gen2 from the list of available output options:

As the next step, you need to fill the form for the output adding. We gave it an alias outputtostorage. The Storage account is specified as blobforstream because this is the name of the Azure Blob Storage account. We create a new container inside that storage and give it a name streamcontainer. Parquet format was chosen as the Event serialization format. Note, that our input receives documents in the JSON format while the output dumps parquet files to the storage. You can see on the screenshots below how we specified the aforementioned and other parameters:


After you click Save, the output will be tested, and if everything is OK, it will be added to the Azure Stream Analytics job.
Now, you need to create a query which will tell what Azure Stream Analytics should do. The queries can be big, performing a very complex data transformation. But here we don’t want to do anything except than just taking the data in JSON format from the input and saving it into Parquet format to output. All other data transformations we will do directly in Dremio. So, go to the Query section of the Azure Stream Analytics job and create the following query:
SELECT
   *
INTO
   outputtostorage
FROM
   inputfromevhub
As soon as you save the query and click on the Overview tab, you should be able to see the following picture:

This is like a summary of the job: how many and which inputs and outputs it has, what is the query, current state of the job (stopped), and other metadata. Click on the Start button to start the job. Wait some time until the job is started. Then, go to the prepared Python script and run it. The script should start generating and sending events.
There is a time lag between the moment of the events dispatching and the moment when the receiving of the events will be reflected in the monitoring metrics of the Azure Event Hubs and Azure Stream Analytics. But in the end, you should be able to see something like this in the Azure Event Hubs:

And something like this in the Azure Stream Analytics monitoring:

The number of the received messages should be equal to the number of sent events (rows in the dataframe, in our case). Note that in our dataset we have 517 rows. The greater number of messages on the images above is due to the tests we performed prior to send the entire dataset.
Go to the Azure Blob Storage and check whether there are some new objects. We can find them in the streamcontainer:

For some reasons, there are two parquet files. We suppose that this is due to the fact that Azure Stream Analytics processed the dataset in two batches. This is not a problem, we will perform their union in Dremio later.
By the way, now you can browse your Blob Storage in a way similar to how you can do it earlier with the Azure Storage Explorer software. Now it is built in the Azure portal (the feature is in a preview mode at the moment):

Now, it’s a time to connect Dremio to Azure Blob Storage.
Azure Blob Storage and Dremio connection
We will need some credentials to connect Azure Blob Storage and Dremio. So, go to the Access keys tab and note down key1:

Then, go to Dremio GUI, select to add a new data source, and click on the Azure Storage. Fill in the following form:

The azure_stream is the name of the datasource. In the Account Name and Shared Access Key, we have entered the credentials from our Azure Blob Storage account. After you click the Save button, you should be able to see the datasource in the list of your datasources. If you open it, you will see the parquet files there:

Click on each of them, check the opened dataframes, and save them:

Now you are ready to start the final step of our work - data curation in Dremio.
Data curation in Dremio
The first thing we need to do is to merge two tables. There is a special button called Join in Dremio, but it performs the join based on some key column. In other words, it joins tables column-wise. We need to add rows from the second table to the rows from the first table. How can we do this?
In Dremio, you can create and run SQL queries. Let’s try to check whether we will be able to merge tables using SQL. We want to count the number of records in the resulting table after merging. To do this, we have to run the query of the following type:
SELECT COUNT( * ) FROM
(SELECT * FROM "table1.parquet" UNION SELECT * FROM "table2.parquet")
Here is the image demonstrating the real query:

We can see that the query return a table where the number 517 is displayed. We know that our original dataframe has exactly 517 records. So, it seems that the query works well. We can remove the “count part” of the query and run it. As a result, the united table should appear:

We have saved this dataframe in the new workspace in Dremio called the stream_space. The name of the table is united_table. Now, let’s go to this table and explore it. We notice that there are 3 redundant columns (EventProcessedUtcTime, PartitionId, EventEnqueuedUtcTime) which were added by Azure services. However, we don’t need them, so we want to remove them. To do this, click on the arrow near the name of the column you want to delete and then pick the Drop button from the drop-down menu:

Also, we want to see the largest fires in the top. To do this, find the area column, call the drop-down menu on it, and select Sort Descending:

All our actions with the dataframe in Dremio immediately generate the corresponding SQL query. For example, our removal and sorting actions have resulted in the following query:

We saved the resulting table in the same workspace and named it cleaned_table.
What if we want to see the data grouped by some columns? Dremio supports aggregations. For example, let’s say we need to look at the total area of fires and average temperatures by month. To do this, click on the Group By button, then select the dimension for grouping (month) and measures you want to compute (sum using the area column and average using the temp column). Then click Apply:

After sorting by area in the descending order, you should get the following table:

As expected, the largest fires happen in the late summer and early autumn, when the weather is warm and dry. September and August are the months with the biggest number of the total area of fires. We saved this table as the month_grouped.
Let’s get back to our cleaned_table. We can see that there are 4 columns with the values for different indices (FFMC, DMC, DC, and ISI). They are all of the different scales. For example, ISI values are closer to 0, while DMC values are often significantly larger (larger than 100 and even 200). If you use the data to build a machine learning model later, this can be a problem. To deal with it, data scientists usually perform the so-called scaling. There are several approaches to scaling, but one of the most popular is the min-max scaling. The values will be reflected in the range from 0 to 1 when the minimum original value will be transformed to 0, and the maximum value will be transformed to 1. Below, we will show how to perform min-max scaling in Dremio using the FFMC column.
First, we will issue the following SQL query to get the minimum and maximum values in the FFMC column:
SELECT MIN(FFMC) AS min_ffmc, MAX(FFMC) AS max_ffmc
FROM cleaned_table
The result looks like this:

We saved this table as min_max_ffmc. The next step is to recalculate each original value in the FFMC column. The following SQL query should do this:
SELECT (FFMC-min_ffmc)/(max_ffmc-min_ffmc) AS FFMC_scaled, *
FROM cleaned_table, min_max_ffmc
If we sort the result table by FFMC in descending order, we will see that the largest values of FFMC were transformed to the values closer to 1 while the small values are concentrated closer to zero:

This table was saved as ffmc_scaled table.
Remember how we group the data by months earlier? What if we want to group data by the seasons (summer, autumn, winter, spring)? The process should be the same, but firstly we are required to specify what month belongs to what season. In Dremio, this can be done using the Replace Text feature. Go to the month_grouped *table, click on the arrow near the *month column, and select the Replace Text… section.
In the appeared window, you will be able to select values which you want to replace and the replacement value. For example, we can click on jun, jul, and aug values and enter summer as the replacement value. Similar actions should be done for all other months and seasons. After each season replacement, click Apply.

The grouping is similar to that we performed earlier. We just added more measurements. The result is the following (seasons_grouped table):

Our initial guess was confirmed: the most fires occur in autumn and summer. Both the total and average area of fires are the highest for autumn, the summer ranks second, the spring and winter comes next.
Conclusion
In this tutorial, we showed how the stream data can be analyzed with the help of Azure Event Hubs, Azure Stream Analytics, Azure Blob Storage, and Dremio. We created a data pipeline which used all these components on its flow. The data producer was a Python script which is similar to a real-world Python application generating live data. Events (messages) from the script were directed to the Azure Event Hubs, which in its turn, transferred them to Azure Stream Analytics. It takes the messages in the JSON format and then dumps them as batches into Azure Blob Storage using the parquet format. The Dremio acted as a final data consumer. It was connected to the Blob Storage to take the data and process it. What you can do with the data after its curation in Dremio is up to your needs.
Try Dremio’s Interactive Demo
Explore this interactive demo and see how Dremio's Intelligent Lakehouse enables Agentic AI


