Every organization considers dashboards a key asset to support their decision-making process. Now, as organizations invest more and more in their data strategy, they constantly focus on making dashboards self-serviceable. The idea is to let any level of user, irrespective of their technical expertise, have access to these reports and be able to answer critical business questions using them. Although dashboards are a crucial step toward an organization’s data democratization goals, there are some downsides associated with how dashboards are traditionally implemented in any enterprise today and how they impact further business decisions.
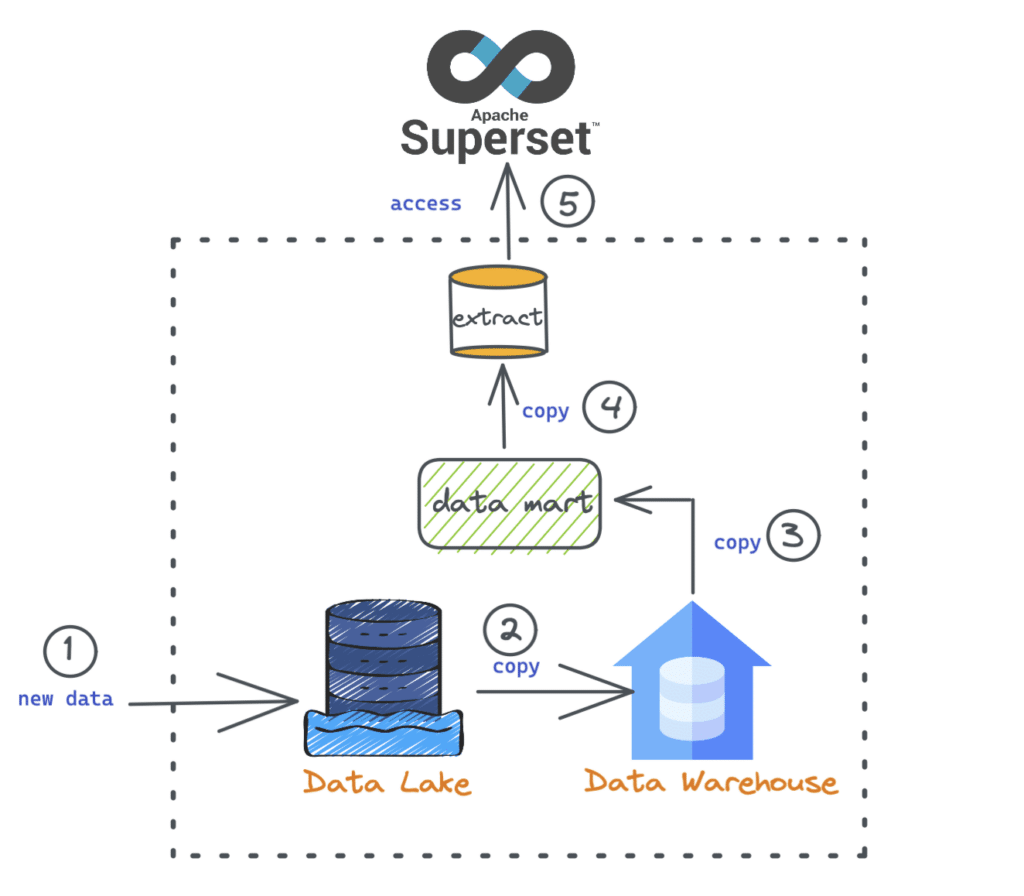
In most organizations today the process of building a dashboard usually looks like the image below:
Data from various sources are ingested into a cloud object storage (data lake).
Data is then ETL'd into a cloud data warehouse (such as Snowflake or Redshift).
A subset of the data is then moved to a data mart specific to a particular report.
For performance benefits, BI extracts are created.
The dashboard is built using the data.
When we drill down and inspect the back-end part of building a dashboard, there are a lot of steps, as shown inside the image above. Also, from a business perspective, requirements change very often. For example, we may have a trend analysis chart today with existing measures such as “sum(sales amount)”, but what if we want to analyze the results by “min or max(sales amount)”? With the traditional approach, this would require us to go through numerous steps and processes before we can make the dashboard available to our stakeholders. You can read more about the steps involved in a dashboard change request here.
So, what are some critical problems with this traditional way of working?
Long data wait requests – The turnaround time to satisfy a particular data request (new or change request) greatly impacts the dashboard development and decision-making process. With this traditional approach, the wait time is usually very high as it goes through a couple of steps until data is available for building the report. The right data at the right time is vital for insights to be relevant.
Unmanageable data copies – One repetitive aspect in the above diagram is that many “copy” processes are involved for either moving data from one system to another or for performance enhancement reasons. These additional data copies become unmanageable over time and lead to issues such as data drift.
Limited to specific data size – Data requirements for building a dashboard vary from task to task. In most of these cases, analysts require access to additional data to present the insights with deeper granularity (quarter vs. day) and history (one year vs. two years). With the current approach, reports are limited to a specific data size available in a warehouse or data mart.
Dashboard performance – With the increase in the dataset's size and complexity, the reports' performance is also impacted. This leads to slower response times on the part of the users, which ultimately affects their ability to ask as many analytical questions as they would like for decision-making.
Cost and overheads – There is a significant cost associated with running BI workloads on data warehouses, which involves costs for computing, storage, etc. Apart from the monetary costs, there are also overheads related to data engineers managing complex ETL pipelines, BI extracts, operational costs, etc., to make data available for reporting.
BI extracts are proprietary – Extracts help optimize a dashboards' performance but are exclusive to a specific BI product. This means another tool or workload cannot take advantage of these optimizations, which locks businesses to a single BI tool and gives no flexibility to migrate to something that better fits their needs.
Ultimately, these problems and complexities raise some crucial questions:
Can we have a data architecture that supports building reports directly on the data lake?
If so, can we meet the performance standards required for a dashboard?
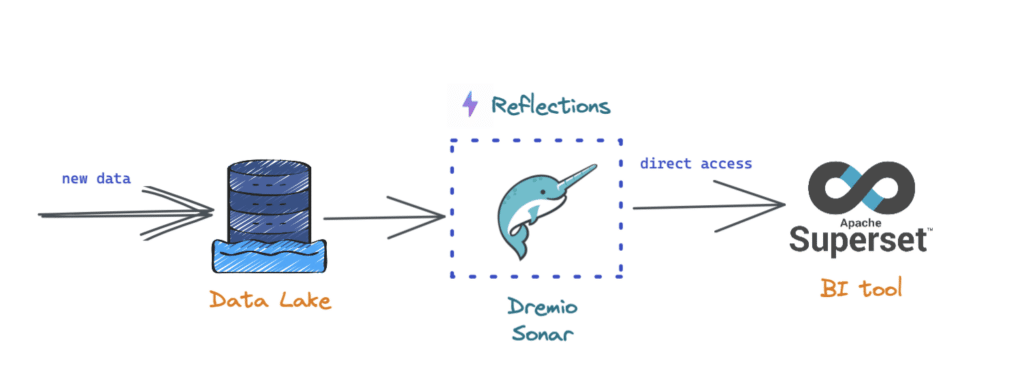
The answer to the above two questions is yes! With the Dremio lakehouse platform, we can now run live queries from various BI tools, such as Apache Superset, directly on the data stored in a cloud data lake and achieve amazing performance. This allows us to deal with all the problems listed above and shifts the focus toward building insightful reports relevant to a particular analysis. If you are new to data lakehouse architecture, here is a detailed read to understand all the benefits.
At a high level, with this new approach, the Dremio query engine (Sonar) sits in between the data stored in a data lake and the client engine (Superset in this case), as shown below. In addition, Dremio also brings in a query acceleration feature called “reflections” that makes querying data super fast, giving the much-needed performance edge to the dashboards.
Now that we know that we can solve the challenges with the traditional way of building dashboards by leveraging a lakehouse platform, let's focus on our problem statement : How do we migrate a Superset dashboard built on top of a data warehouse to a lakehouse?
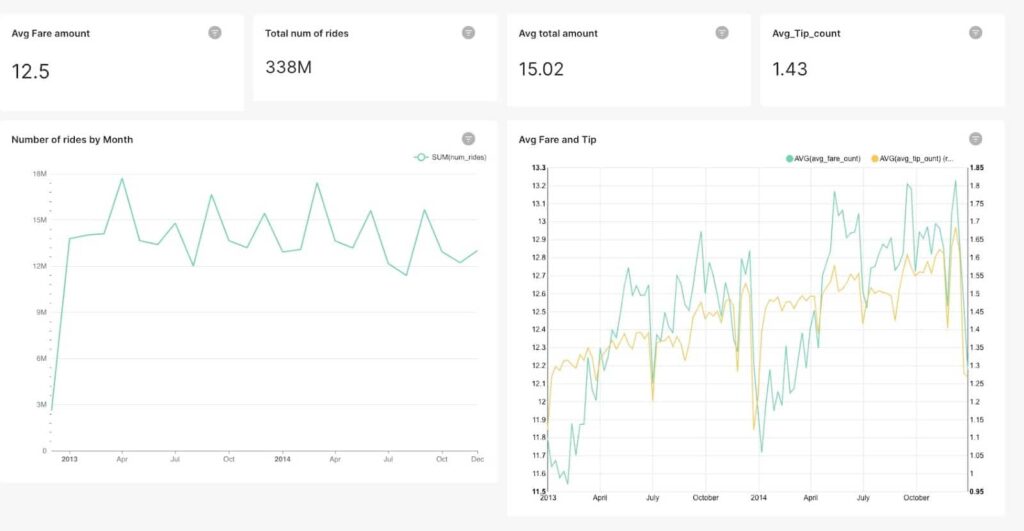
In this exercise below, we will go through five (5) steps to take the below Superset dashboard running on a cloud data warehouse and modify it to run live queries directly against a cloud data lake storage. Let’s go!
5 steps to migrate a Dashboard to the Lakehouse
If you want to just get started with the dashboard and recreate the example described below with the charts, simply download the dashboard and data files here.
Try Dremio’s Interactive Demo
Explore this interactive demo and see how Dremio's Intelligent Lakehouse enables Agentic AI
Step 1: Sign up for a Dremio Cloud account and create a new project
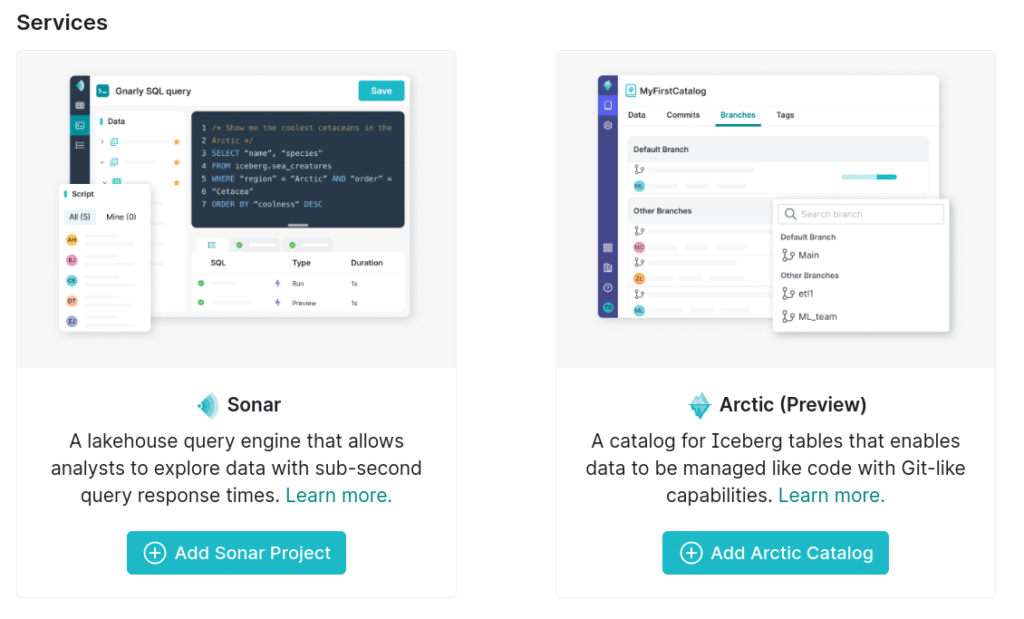
The first step is to sign up for a free edition of Dremio Cloud and create a new Sonar project. You can refer to this document to address any issues when signing up. If you want an easier way to get started, you can also take a test drive here. Once you are done with the setup, you should be able to create your first Dremio Sonar project as shown below.
Step 2: Connect Dremio to the Data lake source
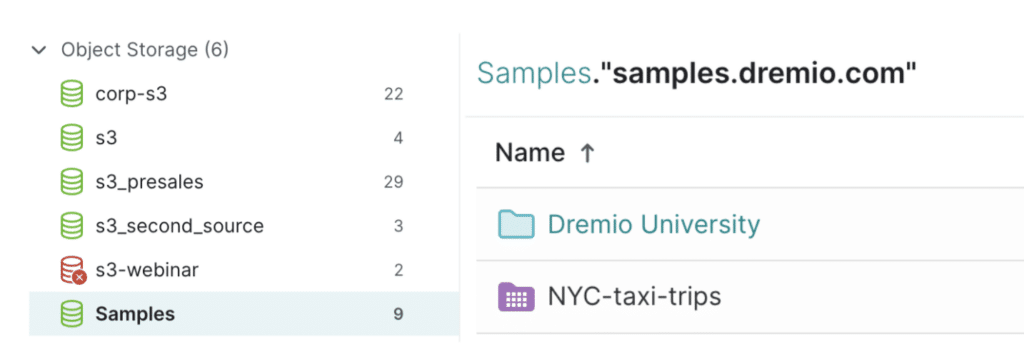
The next step is to link Dremio to the data lake source, an S3 bucket in this specific case. You can see all the data sources in the “Object storage” section. The data lake “Samples” is where our data resides. If we click on this and then on “samples.dremio.com” we should see the “NYC-taxi-trips” folder highlighted below.
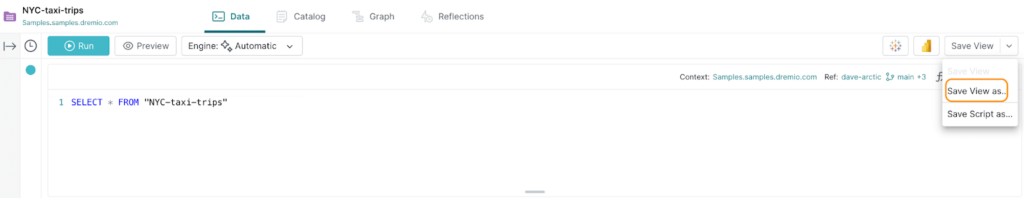
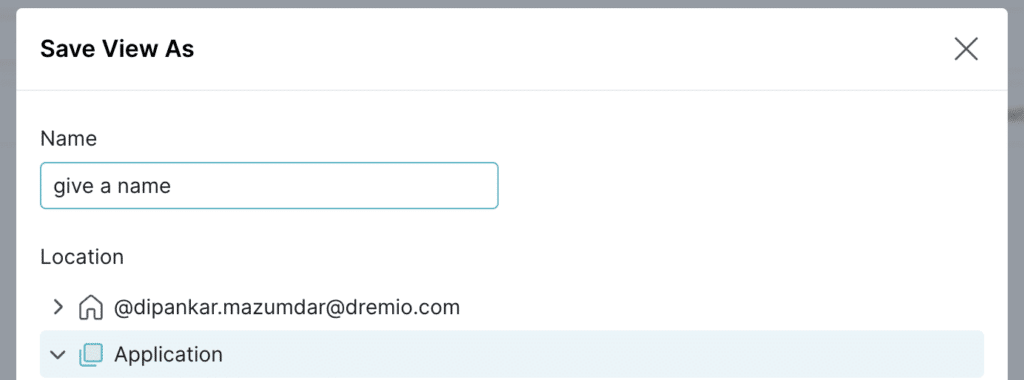
Now let’s create a virtual view of this dataset by clicking on the dataset folder, and then Save View to one of the spaces as shown below (Application view).
Step 3: Configure Dremio in Superset and add it as a new data source
This is one of the crucial steps that will help us understand the prerequisites and configure Dremio for use in Superset dashboards.
Prerequisites: Apache Superset requires an SQLAlchemy dialect to be installed for each data source we want to connect to. For Dremio, the connector is called SQLAlchemy Dremio. Please note that if you are using Preset Cloud (a fully hosted cloud service for Superset), you can skip this step. See this blog for more details.
Depending on how you install Superset — either locally from scratch or using Docker — this connector needs to be installed accordingly using the command below and following the instructions on the Superset side. More information can be found here.
pip install sqlalchemy-dremio
Once we have the connector installed, we are now ready to create our connection to Dremio from Superset.
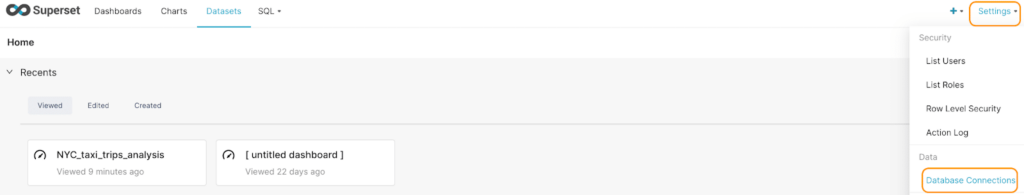
On the Superset main page, click on Settings and then Database Connections as shown below.
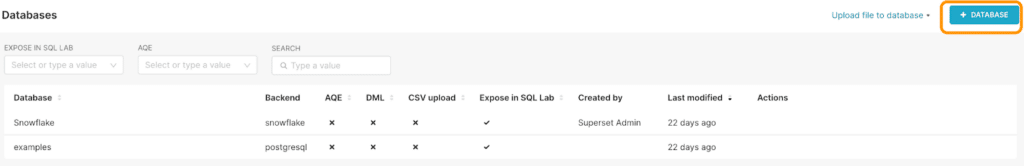
You should now see the list of existing databases here.
Now, click on +Database to add Dremio as a data source.
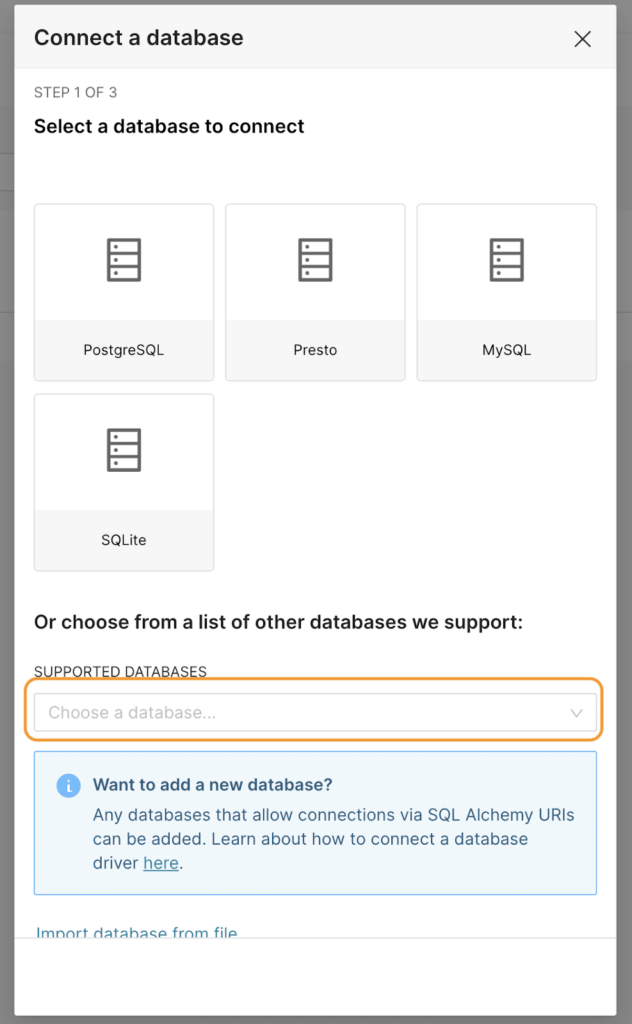
We will now be presented with the screen shown below. From here, click on the Supported Databases section as highlighted.
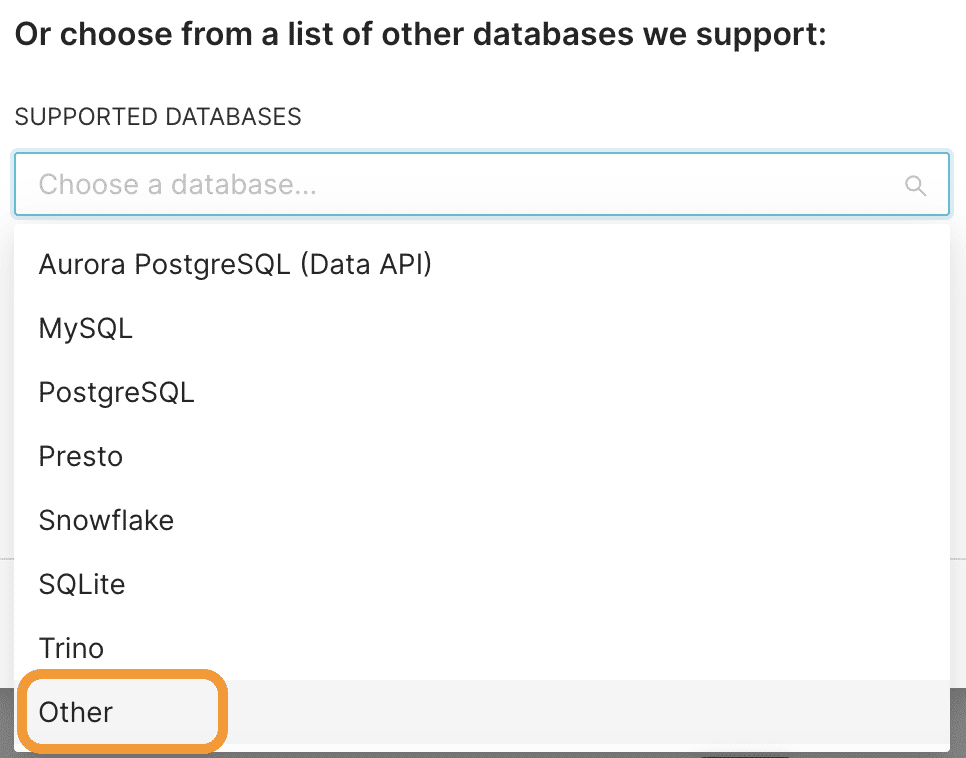
Currently, Superset doesn’t list Dremio as a supported database. So, select Other from this list.
Please note that Dremio is a supported database in Preset (the fully hosted managed service for Superset).
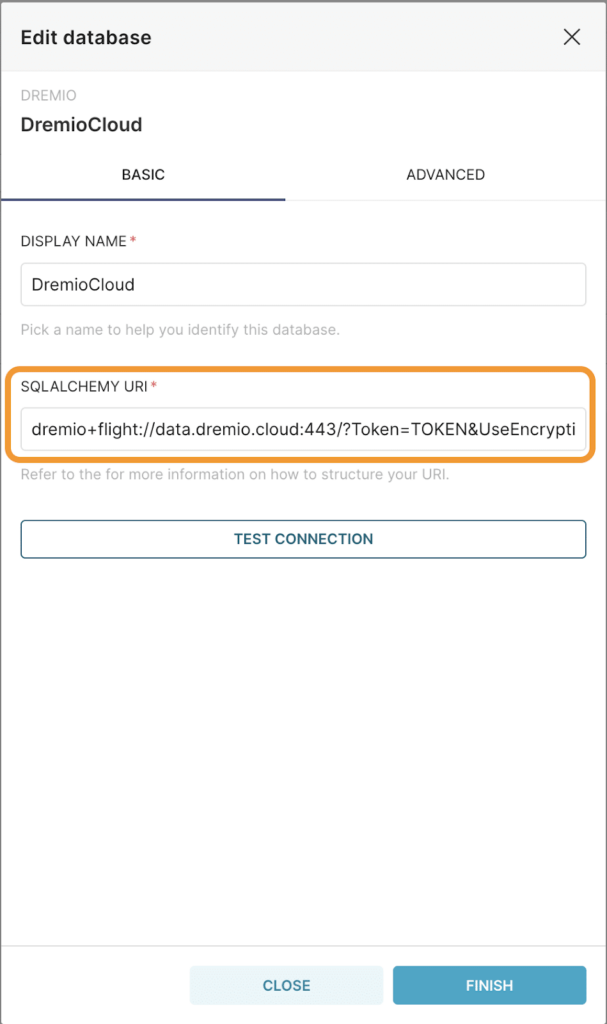
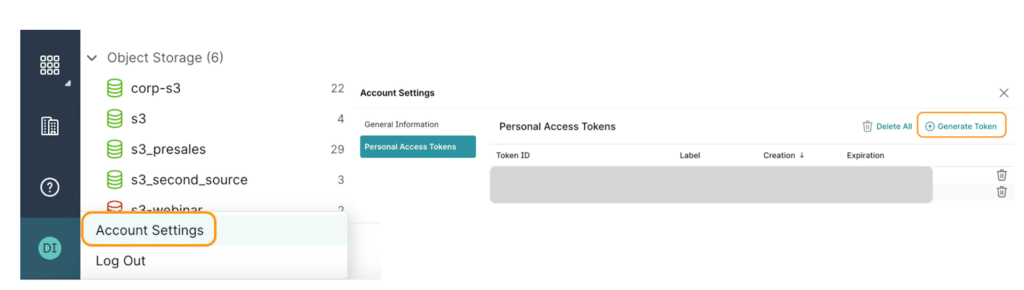
**Note: To get the Personal Access Token (PAT), we can go to the Dremio UI, click on the Account Settings & then Generate a token.
After supplying the right config parameters, we can click on Test connection and if everything looks good, we should see the following message:
Now, click Connect and we should be all set to create new visualizations based on the data in the data lake source using Dremio.
Step 4: Replace the Superset charts’ source from the specific data warehouse to Dremio Cloud
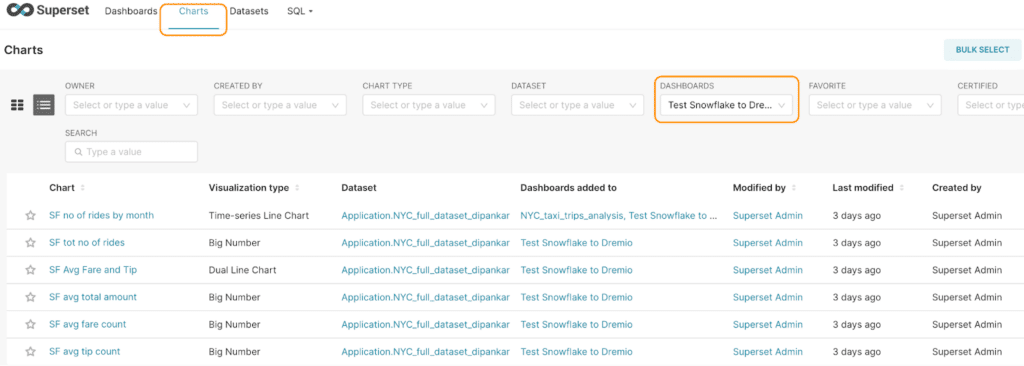
Now, let’s replace the data source of all of the charts used in our dashboard. To see all the charts used in this dashboard, click on Charts & filter by the Dashboard.
Now, click on each of these charts and change the data source from the data warehouse to Dremio lakehouse by following the steps below-
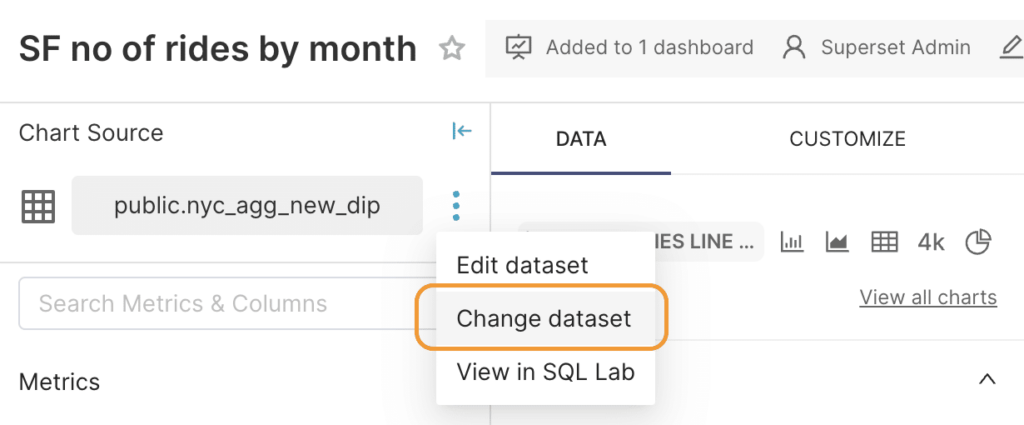
Once you click on a chart, you should be presented with the screen where you build the chart with all the configurations. Click ondots icon and then Change dataset.
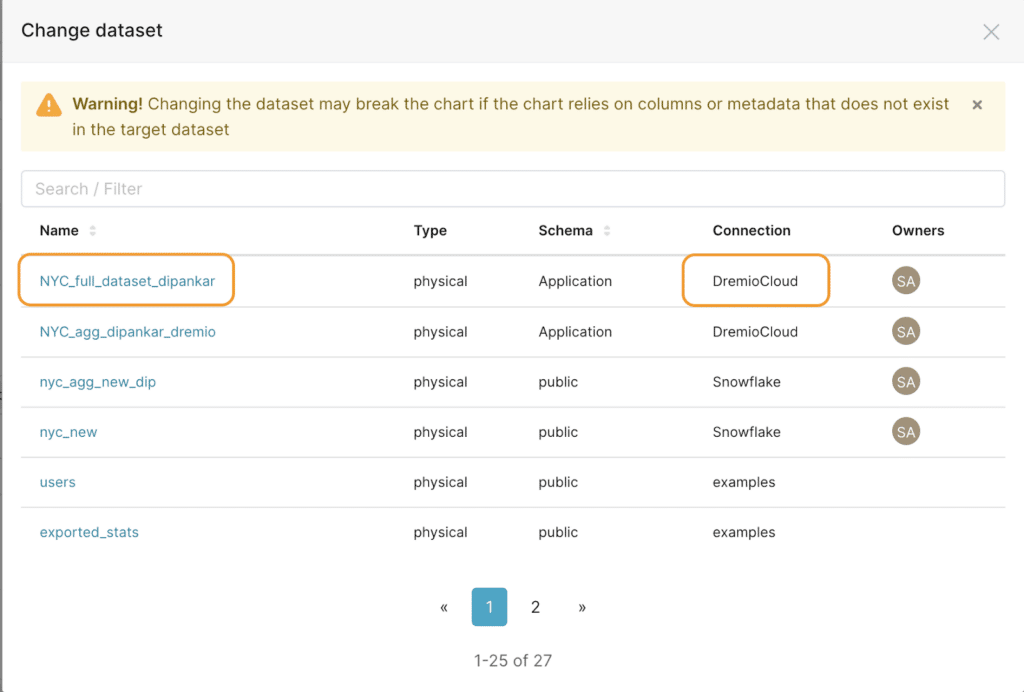
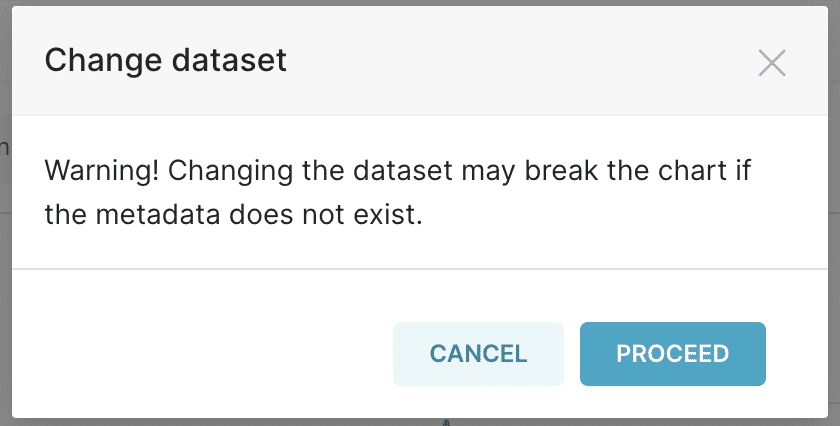
You will now be able to select the dataset you want to use from Dremio Cloud. For this specific tutorial, the dataset from Dremio is called NYC_full_dataset_dremio. So, select that and click on Proceed in the next screen.
Once you proceed, you will see the message shown below, which says we need to add our measure again. This is expected as these fields don’t exist in the dataset in Dremio. One important thing to stress here is that there are always limitations when using an aggregated dataset (from a warehouse) since we cannot access the original data fields and apply transformations as we would like. So, to use any new calculations in our dashboard, we must go through the usual lengthy process of requesting the data and then updating the report.
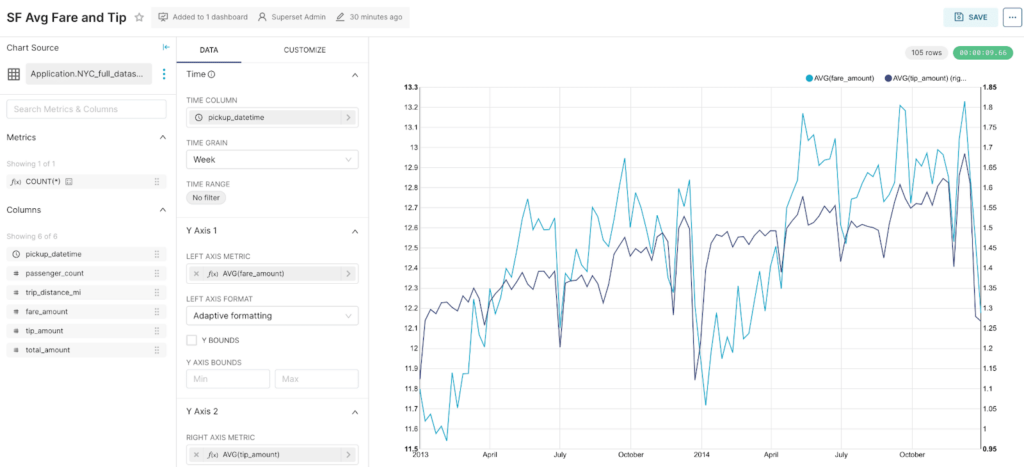
However, with this new approach, we are not tied up with this limitation as we have direct access to the dataset in the data lake. So, this time, we will add a new measure, "Avg(fare_amount)" based on the original dataset, update the chart, and click on Save.
There we go! We now have the chart updated with the source as Dremio lakehouse. Now, let’s do this for all the remaining charts.
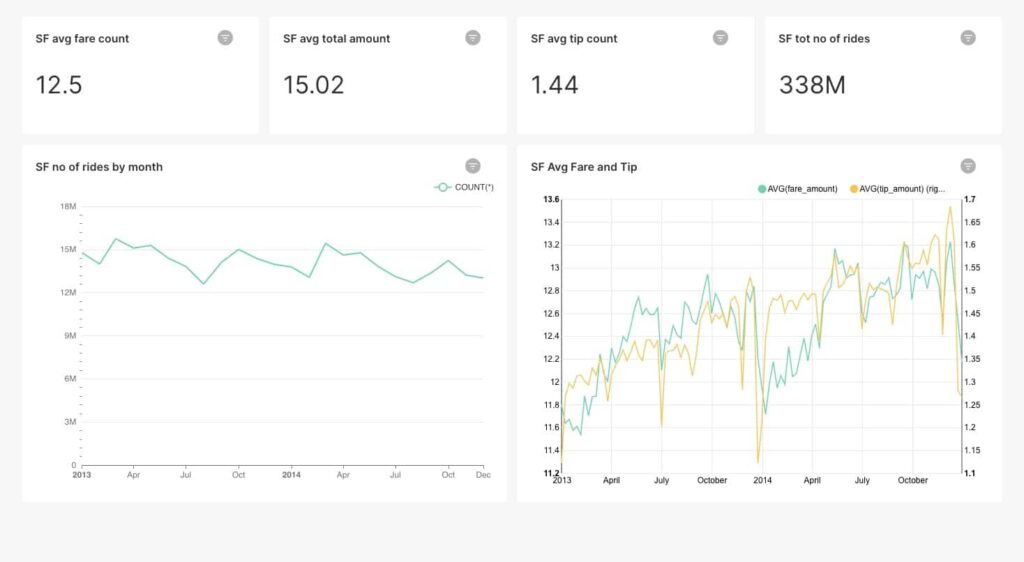
Finally, we migrated the dashboard we built using the aggregated data from our warehouse to run on a lakehouse (Dremio). This means that any query we use with a chart is essentially a live query directly on the data in your data lake. Note that each of these live queries analyzes a third of a billion rows to serve the dashboard.
This new approach eliminates the need to create or manage ETL jobs, warehouses, or BI extracts, thus facilitating faster time to insights.
Step 5: Optimize the Dashboard performance with Dremio Reflections
For the last step, we will optimize the dashboard performance to provide users with a sub-second interactive experience on the data lake, so they are not limited in asking more complex questions.
As of now, if we include a filter on the pickupdate field, depending on the number of values selected, the response time is about three to 10 seconds. Although this is pretty amazing for a dataset with a third of a billion records, Dremio enables us to further accelerate the response time via a feature called reflections.
A reflection can be thought of as a hybrid between materialized views and indexes. By using reflections, Dremio’s query optimizer can accelerate a query against tables or views rather than processing the raw data in the underlying data source. We will need to create reflections for our dataset to take advantage of it in our dashboard.
To do so, let’s go to the Dremio UI and view our dataset to create a reflection.
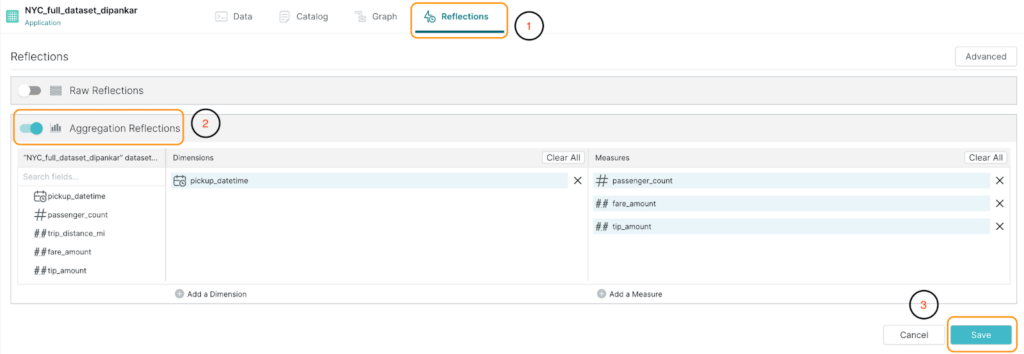
Click on the Reflections tab.
You now have the option to create a raw or aggregation reflection. Since we plan to use this with a dashboard (involves aggregations), we will enable Aggregation Reflections and then save it, as highlighted in the image below.
Please note that Dremio, by default, suggests fields as Dimensions and Measures, but we can add/remove the fields based on our needs.
Now, let's go back to the dashboard and apply a few filters. Again, we should see almost instantaneous responses, delivering a truly interactive experience for the stakeholders, which is supercritical in BI. An important thing to note here is that the optimization of the dashboard's performance was made without us needing to modify the code or logic.
As shown below, we can also go to the Jobs page in Dremio and verify how much time it took to execute the queries.
As we can see, each of these queries took 1-2 seconds to run (some even <1s), which is impressive given the vast amount of records we have in this entire dataset.
Conclusion
In summary, migrating a dashboard from a data warehouse to a data lakehouse presents several benefits. By following the steps outlined in this blog, we should be able to smoothly migrate our dashboard, allowing organizations to derive faster insights from their data and make more informed decisions. This new architecture also broadens the scope of analysis as analysts are no longer limited to a specific dataset, helping them drill down more. Furthermore, by moving to a data lakehouse architecture, organizations can reduce their overall infrastructure and maintenance costs, allowing them to maximize their value from data.
Try Dremio Cloud free for 30 days
Deploy agentic analytics directly on Apache Iceberg data with no pipelines and no added overhead.
Intro to Dremio, Nessie, and Apache Iceberg on Your Laptop
We're always looking for ways to better handle and save money on our data. That's why the "data lakehouse" is becoming so popular. It offers a mix of the flexibility of data lakes and the ease of use and performance of data warehouses. The goal? Make data handling easier and cheaper. So, how do we […]
Aug 16, 2023·Dremio Blog: News Highlights
5 Use Cases for the Dremio Lakehouse
With its capabilities in on-prem to cloud migration, data warehouse offload, data virtualization, upgrading data lakes and lakehouses, and building customer-facing analytics applications, Dremio provides the tools and functionalities to streamline operations and unlock the full potential of data assets.
Aug 31, 2023·Dremio Blog: News Highlights
Dremio Arctic is Now Your Data Lakehouse Catalog in Dremio Cloud
Dremio Arctic bring new features to Dremio Cloud, including Apache Iceberg table optimization and Data as Code.