Intro
Data is nothing without analytics, but built-in features for analysis in BI tools like Qlik are often not robust enough to handle the scale of big data. Therefore, in a continuation of the tutorial series on how to use Dremio with Qlik, in the spotlight today is Hadoop, one of the basic technologies in the field of big data. It’s a framework for data management which gives rich abilities for pre-processing of unstructured data and a scalable and distributed computing. It can also serve as a general-purpose storage that can accommodate petabytes of data. The main responsibility for the last task uses Hadoop Distributed File System (HDFS), which is based on two types of storage nodes: DataNode (actual data) and NameNode (metadata).
However, regardless of all of the advantages, there are still many limitations in Hadoop’s work with some tools, among which is Qlik Sense, an analytics and visualization tool for BI users. It is very hard to run Qlik on Hadoop directly and even after you solve this problem, the workloads are slow. Dremio solves both of these difficulties, making the connection extremely easy and accelerating query execution. With full SQL access, you can freely manipulate, transform, and analyze your data.
We have already shown you how to run Qlik on Elasticsearch and MongoDB and covered some basics of Qlik Sense in our previous tutorials. This time, we will focus on data preparation using Dremio and on visualizations that we haven’t covered before.
Assumptions
We recommend that you get acquainted with Analyzing Elasticsearch With Qlik Sense and MongoDB to get a better understanding of the connection process and Qlik’s capacities. Of course, Dremio and ODBC driver are required to follow the tutorial by yourself; if you don’t have them already go to Dremio deployments page and pick the installations for your operating system. Also, you will need Hadoop v.2.8.3 and HDFS in particular, and Qlik Sense Desktop. Make sure they are configured properly. Learn about how to setup and configure Dremio with files stored in HDFS here.
To follow this tutorial you should have access to a Dremio installation. If you haven’t done so already, installing Dremio is easy - see the Quickstart for instructions.
We also think it will be easier if you’ve read Getting Oriented to Dremio and Working With Your First Dataset. If you have questions along the way, don’t hesitate to ask on the Dremio Community Site.
Loading Data into Hadoop
Hadoop is designed to store a large number of big files, but for the purposes of this tutorial, we have chosen a smaller dataset. We will be exploring Kaggle’s Diamonds dataset for visualization and analysis, which contains data on the price, cut, color, clarity, price, and other attributes for almost 54,000 diamonds.
The first step is to upload the data to our HDFS cluster. Go to the command line and navigate to sbin in the Hadoop home directory. Then run the start-all.cmd command. Note that in other versions of Hadoop this command may differ.
Now let’s create the /user/dremio directory in our HDFS system.
hadoop fs -mkdir /user/dremio
Finally, we can upload the data to this folder with the following command
hadoop fs -put <PATH_TO_FILE>/diamonds.csv /user/dremio
Note that whether you upload data or not, you still have to start Hadoop before connecting to the HDFS cluster in Dremio.
Data curation in Dremio
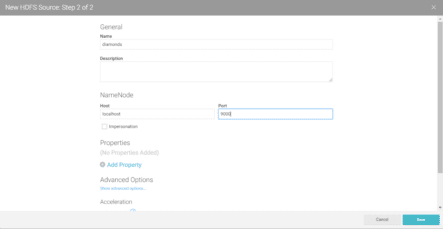
Let’s start by creating a new space to be able to share our datasets with other users. We will name it Hadoop. Then, connect to the source by clicking Add source or + sign, select HDFS, and provide the details of your cluster.

As we are running it on the same machine, we connect to localhost. Dremio proposes Port 8020, but make sure that it matches the port where Hadoop stores your data, the one you selected when installing Hadoop. In our case, it’s 9000. You can also review the advanced options. Thereafter, click Save.
Now, if you navigate to Diamonds source -> User -> Dremio you will see the csv file that you have previously uploaded to your cluster. Hover over that file and click on the icon at the very right to go to the Dataset Settings menu.

The format you need to choose is Text (delimited) with Comma delimiter. Check the Extract Field names option and choose LF - Unix/Linux as the Line Delimiter. After your data is properly formatted, save it.

Now, it’s time to do some data preparation, and we will start by changing the data types by clicking the Abc button near the column name. Convert carat, depth, and x, y, z coordinates to float and table and price to integer.

We also want to create a new variable. Click Add Field and you will see the window with available options.

We will name the new variable Volume and define it with expression xyz. Check out other existing functions on the right.

After all the executions, SQL Editor automatically writes:
SELECT A, x*y*z AS volume, carat, cut, color, clarity, depth, nested_1."table" AS "table", price, x, y, z
FROM (
 SELECT A, carat, cut, color, clarity, depth, nested_0."table" AS "table", price, x, y, z
 FROM (
   SELECT A, CONVERT_TO_FLOAT(carat, 1, 1, 0) AS carat, cut, color, clarity, CONVERT_TO_FLOAT(depth, 1, 1, 0) AS depth, CONVERT_TO_INTEGER("diamonds.csv"."table", 1, 1, 0) AS "table", CONVERT_TO_INTEGER(price, 1, 1, 0) AS price, CONVERT_TO_FLOAT(x, 1, 1, 0) AS x, CONVERT_TO_FLOAT(y, 1, 1, 0) AS y, CONVERT_TO_FLOAT(z, 1, 1, 0) AS z
   FROM diamonds."user".dremio."diamonds.csv"
 ) nested_0
) nested_1
Let’s save our dataset for now. Click on Save as and choose previously created Hadoop space.

Connecting to the dataset in Qlik Sense
Click on the Analyze button at the top right corner of the toolbar and select Qlik Sense, which should be started from your computer.

After the connection is established, navigate to Qlik Sense either in a browser or through the desktop version and click Open in the pop-up window to get to the data load editor. There are Edit connection and Select data icons on the right.

Pick the Dremio connector and make sure everything is set for SystemDSN and for the right version of bit system for your machine. Then click on Select Data, choose DREMIO database, Hadoop owner, and preview your data. Toggle Include LOAD statement and then click insert script.

For the correct loading of data the editor should look like following:
SET DirectIdentifierQuoteChar='"';

LIB CONNECT TO 'Dremio';

LOAD A,
    volume,
    carat,
    cut,
    "color",
    clarity,
    depth,
    "table",
    price,
    x,
    y,
    z;

SQL SELECT A,
    volume,
    carat,
    cut,
    "color",
    clarity,
    depth,
    "table",
    price,
    x,
    y,
    z
FROM DREMIO.Hadoop.diamonds;
Finally, click on Load data at the top right corner and wait for the successful completion.
Building visualizations and analyzing data in Qlik
Now it’s time to go to App overview and start exploring visualizations. We will begin with analyzing the relations between five variables, in particular the price, color, depth, clarity, and cut of the diamonds. This is our final dashboard, but let’s go step-by-step to how we got there.

To begin with, from the charts menu drag the Box plot icon to the editor area and select A as a dimension and pick price as a measure. Then go to the properties panel on the right and add color as another dimension in the Data section.

You can also specify other parameters like Box plot elements and appearance. For instance, we changed the coloring and selected not to include outliers.
The next object is KPI. Again, simply drag it to the editor and select Avg(depth) as a measure. Colors and other features are up to your choice.
And last but not least, the filter pane. We must use this to make our visualizations flexible and dynamic. Let’s make cut and clarity the dimensions.
Now, if you click Done in the top right corner, you will have the dashboard exactly like we showed earlier. You are able to select and highlight the data you need depending on the filters which give you the opportunity to see the most explicit picture.
However, if you want to perform even more detailed analysis of your data you can easily do this in Dremio. For example, when you group data for visualization in Qlik you can use a lot of aggregations like Avg, Sum, Min, Max, but the list of this functions are still not comprehensive.
So, now we will create a new dataset with some supplementary features in Dremio and then import it for further visualization into Qlik. First, we will go back to Dremio and group the data by table variable. To do this, simply click on Group By button.

Now you can enjoy Dremio’s user friendly interface for data manipulation. Choose dimensions and measures as on picture below:
- table - as a grouping variable,
- volume, carat, and price as measures with aggregations like Average and Standard Deviation.

This is what we were talking about - Dremio can provide some additional functions for your data, like Standard Deviation, that you can’t use in Qlik directly.

SELECT diamonds."table" AS "table", AVG(volume) AS Average_volume, AVG(carat) AS Average_carat, AVG(price) AS Average_price, STDDEV(volume) AS Standard_Deviation_volume
FROM Hadoop.diamonds
GROUP BY diamonds."table"
Now, after applying changes to our dataset, we save it as grouped_diamonds in Hadoop Space.
To upload additional dataset into Qlik, we need to change the data load script. Just go to data load editor in Qlik Sense and then click on Select data as we did earlier. Choose the Hadoop owner and insert the script.

In general, these lines will be added to the script.
LOAD "table",
    "Average_volume",
    "Average_carat",
    "Average_price",
    "Standard_Deviation_volume";
SQL SELECT "table",
    "Average_volume",
    "Average_carat",
    "Average_price",
    "Standard_Deviation_volume"
FROM DREMIO.Hadoop."grouped_diamonds";
Then click on Load data button and wait for successfully uploaded data.
Let’s build new visualizations with the second dataset.
We will display average parameters such as volume and price for different groups depending on the table variable using Combo Chart.
Again, drag Combo chart to your sheet and add table as a dimension and two measures: Sum(Average_volume) and Sum(Average_price). Average_volume we will display as a line and Average_price as bars. To make our chart better looking, scale your Average_price by dividing by thirty. The second measure will look like Sum(Average_price)/30.
And here is what we obtain:

Conclusion
In this tutorial we showed you how Qlik’s abilities to work on an HDFS cluster can be enriched through Dremio. Among the main benefits are a simple connection, acceleration of Qlik’s facilities, and a wide range of possibilities for data manipulations through the user-friendly Dremio interface. The combined capabilities of Dremio, Qlik, and Hadoop are much broader than this tutorial can cover, so now it’s your turn to explore!


