18 minute read · May 14, 2019
Analyzing ADLS and Elasticsearch With Dremio and Qlik Sense
· Dremio Team

Intro
Azure Data Lake Store is a highly scalable and secure data storage and analytics service that deals with big data problems easily. It provides a variety of functions and solutions for data management and governance.
Elasticsearch is a powerful search and analytics engine. It is highly popular due to the scale-out architecture, JSON data model, and text search capabilities. Also, with the help of Elasticsearch, you can index and query large amounts of structured data, use convenient RESTful API, and more.
Unfortunately, Qlik doesn’t work with Elasticsearch, and combining data from different sources might be a challenging task. In this tutorial, we will show how to join data from Azure Data Lake and Elasticsearch in Qlik Sense using Dremio. So, let’s look closer to how these tools work together.
Assumptions
We assume that you have Dremio and ODBC driver installed; if not, go to Dremio’s deploy page, pick the installations for your operating system, and visit Dremio Docs to read about installations and deployments. You should have an Azure Account and storage account; also, we will be working with ElasticSearch, and Qlik Sense, so you need to have them installed and configured as well.
Importing data into sources
We will explore Barcelona dataset available in Kaggle. Originally it’s from Open Data BCN portal, the Ajuntament de Barcelona’s open data service. The dataset contains 16 tables, so we can perform a comprehensive analysis. In this tutorial, we will concentrate on migration. For this, let’s use the next two tables:
- Immigrants_by_nationality.csv - immigrants by nationality and by neighborhoods of the city of Barcelona (2015-2017).
- Immigrants_emigrants_by_sex.csv - immigrants and emigrants by sex by neighborhoods of the city of Barcelona (2013-2017).
Setting up Azure Data Lake Storage
Go to Azure portal and find Data Lake in All services -> Storage :

After that, create a new instance by clicking Add in the top line menu:

Then, go to Data Explorer and upload our first file.

Getting Elasticsearch Ready
Now, we need to upload the second file to Elasticsearch. First, run it and check whether everything is connected properly with the next command:
curl http://localhost:9200
To upload the dataset we can use PowerShell or Terminal, but let’s do this with the help of Python. For that we need:
- 1. Load our dataset to Python
- 2. Transform each row in json format
- 3. Upload data to Elasticsearch

import pandas as pd
data = pd.read_csv("immigrants_emigrants_by_sex.csv")
import requests
import json
from tqdm import tqdm
for i in tqdm(range(len(data))):
   year = int(data.iloc[i]['Year'])
   dictrict_code = int(data.iloc[i]['District Code'])
   dictrict_name = data.iloc[i]['District Name']
   neighborhood_code = int(data.iloc[i]['Neighborhood Code'])
   neighborhood_name = data.iloc[i]['Neighborhood Name']
   gender = data.iloc[i]['Gender']
   immigrants = int(data.iloc[i]['Immigrants'])
   emigrants = int(data.iloc[i]['Emigrants'])
   r = requests.put('http://localhost:9200/immigration/_doc/{}'.format(i + 1),
                    data=json.dumps({'year': year, 'dictrict_code': dictrict_code,
                                     'dictrict_name': dictrict_name, 'neighborhood_code': neighborhood_code,
                                     'neighborhood_name': neighborhood_name, 'gender': gender,
                                     'immigrants': immigrants, 'emigrants': emigrants}),
                    headers={'Content-Type': 'application/json'},
                    auth=requests.auth.HTTPBasicAuth('admin', 'admin'))
To make sure we did everything right, let’s check the first record:

Connecting to Dremio
When data is uploaded, log in to Dremio and choose an option to add a new source.
Azure Data Lake Storage
Before connecting we need to do some preparations:
- 1. Go to Azure Portal and select Azure Active Directory from the left navigation bar. Then select App Registrations.
- 2. Click on Endpoints and copy OAUTH 2.0 TOKEN ENDPOINT to Dremio source form.
- 3. Click New application registration. Select a Name, choose Web app / API as type and enter a Sign-on URL. This URL can be a valid arbitrary URL.
- 4. Click on the registered app and copy Application ID to Dremio source form.
- 5. While in the registered app, select Keys under API Access. Enter a Description and select an expiration. Click Save and copy Value to Dremio source form.
- 6. Also, in Data Explorer -> Access provide your app access to read, write and execute data.

After that, fill in the required fields as shown below:

Elasticsearch
In order to connect to Elasticsearch, write localhost as a Host and choose No Authentication. You can also go to advanced options to take benefit from the Dremio connection.

Here you can see our folder:

Data curation in Dremio
Now, we can begin data preprocessing. Let’s start with ADLS source and convert all integer values to an integer type:

As you may have noticed, our neighborhood codes and names contain 74 different options which repeat for each nationality.

In order to prevent mistakes during joining data, it is necessary to group those values. For that, choose Group by and select Year and Nationality as dimensions and Sum of Number as measure as shown below:

We will need to perform similar manipulations with our Elastic data. Click Group by and select Year and Gender as dimensions and Sum of Immigrants and Sum of Emigrants as measures.

Here is the Elastic SQL statement:
SELECT Year, Gender, SUM(Immigrants) AS Sum_Immigrants, SUM(Emigrants) AS Sum_Emigrants
FROM Elastic.immigration."_ doc"
GROUP BY Year, Gender
Now, let’s join data from Azure and Elasticsearch. Go to one of the datasets, for example, ADLS dataset, click Join and choose the desired table:

Next, choose Inner type join and Year as a Join condition.

After joining, let’s clear our final table and drop duplicated Year column:

After all the preparations, Dremio will automatically generate the final SQL script.
SELECT nested_0.Nationality AS Nationality, nested_0.Sum_Number AS Sum_Number, nested_0."Year" AS "Year", join_2.Gender AS Gender, join_2.Sum_Immigrants AS Sum_Immigrants, join_2.Sum_Emigrants AS Sum_Emigrants

FROM (
 SELECT CONVERT_TO_INTEGER(immigrants_by_nationality."Year", 1, 1, 0) AS "Year", Nationality, SUM(CONVERT_TO_INTEGER(Number, 1, 1, 0)) AS Sum_Number
 FROM ADLS.immigrants_by_nationality
 GROUP BY CONVERT_TO_INTEGER(immigrants_by_nationality."Year", 1, 1, 0), Nationality
) nested_0

INNER JOIN Elastic.immigration."_ doc" AS join_2 ON nested_0."Year" = join_2."Year"
We have created a new space for our data and will save it there.

Building visualizations with Qlik Sense
Firstly, we need to connect Dremio to Qlik Sense. This can be simply done by clicking Qlik Sense button at the top right corner of the toolbar:

Note, that you have to open your Qlik Sense app before. Provide your password:

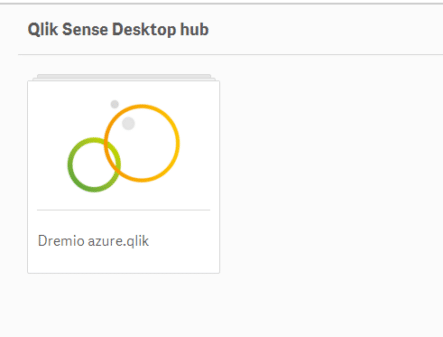
Now, open the prepared app:

Choose Edit connection and make sure that the connection is set for SystemDSN and the right version of bit for your machine.

Then, modify the SQL script to this look:
SET DirectIdentifierQuoteChar='"';
LIB CONNECT TO 'Dremio';
LOAD "Gender", "Nationality", "Sum_Immigrants", "Sum_Emigrants", "Year", "Sum_Number";
SQL SELECT "Gender", "Nationality", "Sum_Immigrants", "Sum_Emigrants", "Year", "Sum_Number"
FROM "azure"."qlik";
Click Load data:

After the data has been uploaded, we can proceed to building visualizations.
Here is our sheet. On the left, you can see a list of the fields.

In order to create a chart, drag the required fields to your sheet. To begin with, we will build a bar chart and add two filters to it. As a result, we will receive information about the number of emigrants and immigrants by gender and nationality in each year. So, for the bar chart, let’s choose Year as dimension, and Sum of Immigrants and Sum of Emigrants as measures.

For better data control we can use filter pane. Drag this chart to the sheet and add necessary fields as dimensions.

As a result, we can see an example of selecting only Female records:

Also, you may notice that the number of immigrants is always higher than the number of emigrants.
Now, let’s look at immigrants distribution by nationality. For that, drag Nationality as dimension and Sum of Immigrants as measure.

As you can see, the highest number of immigrants is from Spain which doesn’t really provide a clear picture for other nationalities. That’s why we will use filter pane again and, for example, choose only 4 countries.

Moreover, you can change the chart type using Select a chart tab. You can use the recommended charts or try different ones which you want.

Conclusion
In this tutorial, we showed how to work with Azure Data Lake Storage and Elasticsearch and how to configure their connection to Dremio. We performed data curation with the help of Dremio, easily changing data types, replacing text, deleting unnecessary columns and joining tables. Finally, we explored our data by building visualizations with Qlik Sense.
We hope you enjoyed this tutorial, stay tuned for more tutorials and resources to learn how you can use Dremio to start gaining insights from your data, faster.


