Memory Arbiter is a new and important feature that was released to Dremio Cloud and is coming to Dremio 25.0. MA enables executors to better utilize their direct memory by accurately tracking its usage across certain operators and, where possible, dynamically reducing the memory footprint of those operators to allow others to consume it. This, along with Spillable Hash Join, is the first of several features in the pipeline for Dremio to react better to diminishing resources and keep running where it previously would have failed.
How Memory Arbiter changes execution
Memory Arbiter changes execution for a particular set of operators once a fragment of work has landed on an executor and processing is underway. The way queries are planned and initial memory allocation remain the same and follow this flow:
A query is submitted, and a plan is generated
Based on the constituent operators of the plan and metadata regarding the source, a minimum viable estimate is generated
For operators that do not hold or expand as data is processed, this is a small static number
For operators that do hold or expand as data is processed, formulas are leveraged to generate this initial allocation based on the stats of the queried datasets
The initial memory allocation for a fragment of execution is made on the executors
Further memory allocations are made throughout the execution of the fragment as needed
The key differentiator is the final point. Previously, all operators would request as much memory as needed until query completion or memory exhaustion. Existing guard rails did offer some fault tolerance but would often intervene too late and not be able to prevent query failure. For example, spillable operators had their spill trigger point defined during planning; however, if one encountered an out-of-memory exception, it would start spilling instead. This would prevent failures, but such an exception signals there is little headroom available to continue execution. With Memory Arbiter, executors are now able to react more quickly to changes in allocatable memory instead of relying on arbitrary spill points set in the plan or an out-of-memory exception.
How Memory Arbiter Works
As mentioned above, Memory Arbiter only changes the execution of four operators (as of the time of writing):
Hash Join
Hash Agg
External Sort
TopN
These operators are often the highest memory consumers and, importantly, also have a mechanism to shrink their memory usage. Hash Join, Hash Agg and External Sort can spill in mid-operation, and the TopN can discard data structures that were used while processing and are no longer needed for the output. Each executor has its own Memory Arbiter that tracks each instance of these operators, the amount of memory they’re using and, importantly, the amount of memory they’re able to give up. If memory usage on an executor crosses a threshold, Memory Arbiter will start requesting that these operators shrink their usage, starting with the one with the most to give. Memory Arbiter also acts as a middleman for new memory allocation requests for these operators. Therefore, requests to shrink can be paired with temporarily blocking new memory allocations, thus reducing existing allocations and growth rate.
Memory Arbiter only tracks Direct memory since data processing happens in Direct memory. Not all operations in Direct memory are being tracked, despite Memory Arbiter's best efforts, Direct memory exhaustion remains possible.
Testing Memory Arbiter and Spillable Hash Join
The addition of Memory Arbiter and Spillable Hash Join is a significant change that requires expensive testing. We used TPC-DS, our Regression suite, and a new suite based on Customer queries. The customer queries selected were either very complex or were prone to failures before Memory Arbiter. All of these were compared to runs of the same version of Dremio with the features disabled.
Test Suite
Data
Run style
Number of executors
TPC-DS
1TB partitioned and non-partitioned
In-series
2, 4, 8
Concurrent 10, 20, 50
10TB partitioned and non-partitioned
In-series
16
100TB partitioned
In-series
32
Regression
Synthetic - relatively small to allow for faster cycles
In-series
8
Customer Queries
Synthetic - Same size as the original data set
In-series
8
We targeted 0 failures with a 5% performance delta for all executor counts.
With the inclusion of Memory Arbiter and Spillable Hash Join, Dremio could complete a full 100TB TPC-DS run without failure, which was previously impossible.
Initial Customer Testing
Multiple EE Cloud customers took part in the private beta. Some had been experiencing memory-related issues, while others were more to gauge any perceived performance impact. Comparing the same-sized time window before and after the features enablement (close to two months on either side), we saw some very positive results for customers facing memory-related issues.
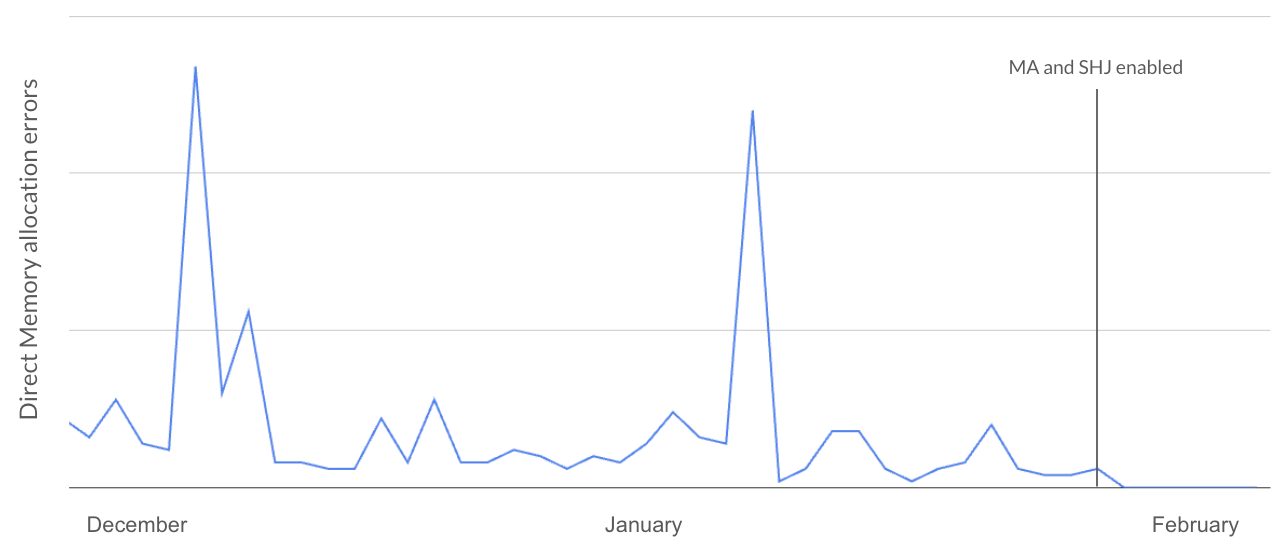
The highest saw a 90% decrease in Direct memory allocation errors, with the lowest seeing a 56% decrease. This graph shows the customers that saw the 90% decrease:
MA = Memory Arbiter, SHJ = Spillable Hash Join. The two spikes were driven by an automated process, which repeatedly submitted the same query, even if it had not succeeded before and was destined to fail again.
The graph shows direct memory errors occurred with a relatively constant background rate with some spikes. After the enablement, these errors dropped immediately and lastingly.
The results for customers testing for performance degradation during day-to-day operation were also positive, with one asking if we’d forgotten to switch it on.
Recommended changes to WLM
This only concerns customers using Dremio self-managed once it launches in version 25.0. If you have set queue memory limits, we recommend removing them. The queue and job memory limits help self-managed customers avoid the noisy neighbor problem between workloads of varying priority. However, the queue and job memory limits are relatively heavy-handed and may intervene despite Memory Arbiter having the situation under control, thus diminishing its effectiveness.
Closing
With the Cloud general availability release behind us, we’ve been very happy with the results and are looking forward to the imminent 25.0 software release. We are already planning how to enhance the feature further with additional shrinkable operators, a better shrink selection algorithm, prioritized operators, integration with other monitoring systems, and others.
Try Dremio Cloud free for 30 days
Deploy agentic analytics directly on Apache Iceberg data with no pipelines and no added overhead.
Ingesting Data Into Apache Iceberg Tables with Dremio: A Unified Path to Iceberg
By unifying data from diverse sources, simplifying data operations, and providing powerful tools for data management, Dremio stands out as a comprehensive solution for modern data needs. Whether you are a data engineer, business analyst, or data scientist, harnessing the combined power of Dremio and Apache Iceberg will undoubtedly be a valuable asset in your data management toolkit.
Oct 12, 2023·Product Insights from the Dremio Blog
Table-Driven Access Policies Using Subqueries
This blog helps you learn about table-driven access policies in Dremio Cloud and Dremio Software v24.1+.
Aug 31, 2023·Dremio Blog: News Highlights
Dremio Arctic is Now Your Data Lakehouse Catalog in Dremio Cloud
Dremio Arctic bring new features to Dremio Cloud, including Apache Iceberg table optimization and Data as Code.