Intro
Apache Hive is an open source data warehouse software, used for processing large amounts of data. It supports different storage types and ensures fast data management. Sometimes it is necessary to perform analysis of the data stored in Hive with other powerful tools, for example, Keras - an open source high-level API for Deep Learning written in Python. So, in this tutorial, we will show how to access Hive data from Dremio and analyze it with Keras.
Assumptions
This tutorial was developed in Ubuntu 16.04. Please make sure, that you have installed and configured all the requirements:
- Python
- Apache Hadoop
- Apache Hive
- Dremio ODBC Driver
- Keras.
Loading data into Hive
In this tutorial, we will use Pima Indians Diabetes Database. The objective of this dataset is to predict whether a person has diabetes based on other medical parameters, such as BMI, number of pregnancies, insulin level, and so on. Download ‘diabetes.csv’ and save it to your directory.
First, you have to install Hive. Installations steps are described in the official installation guide.
Then, go to the HIVE_HOME directory to launch Hive. After that type this command in your terminal:
sudo ./hive
Now we will create an empty ‘disease’ table and load our data there. We have to specify every column and its type.
CREATE TABLE disease ('Pregnancies' int, 'Glucose' int, 'BloodPressure' int, 'SkinThickness' int, 'Insulin' int, 'BMI' double, 'DiabetesPedigreeFunction' double, 'Age' int, 'Outcome' int) row format delimited fields terminated by ',';
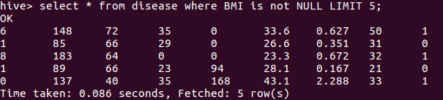
LOAD DATA LOCAL INPATH '/home/user/diabetes.csv' INTO TABLE disease;To be sure that we have loaded data correctly, let’s run following command. This command will display the first five rows of the dataset:
SELECT * FROM disease WHERE BMI is not NULL LIMIT 5;
And the result is:

As we can see, the data is loaded correctly. Now, we will connect to Hive with Dremio.
Connecting to data with Dremio
In order to connect Dremio to our data, you should firstly launch Hive with Metastore service with the next command:
sudo ./hive --service metastore
Then, make sure you have followed all Dremio installation instructions, launch it and go to http://localhost:9047. After logging in, we have to create a new data source. To do that, press the ‘+’ button near the Sources menu.

Select the Hive source.

Enter the connection details. We will choose ‘hive_test’ as the name of our Source, ‘127.0.0.1’ as our default Metastore host and default ‘9083’ port.

After that you will see a new data Source like that:

In Dremio 3.0 there is an ability to create searchable tags, descriptions, and annotations on our dataset. We will add some description about our ‘disease’ table and its source. For detailed instructions please follow this tutorial.

Data curation in Dremio
Let’s drop all rows with huge values of ‘Pregnancies’. To do that, click near the name of the column and select ‘Keep Only…’

You will see the bar plot of all values of ‘Pregnancies’ and their percentages. We will discard values that have value more than 14.

Once you are ready, click ‘Apply’. You will see an SQL Script that performs these curations for you.
SELECT Pregnancies, Glucose, BloodPressure, SkinThickness, Insulin, BMI, DiabetesPedigreeFunction, Age, Outcome
FROM hive_test.disease
WHERE 14 > Pregnancies
Now click ‘Save as…’ to save changes. Choose the name of your new dataset and save it to your space. Once ready, click ‘Save’. 
Analyzing data with Keras
Now that we have performed some data curation, it is time to make the analysis on our dataset with Keras. We will build a basic neural network for predicting whether a person has diabetes step-by-step.
Let’s import all libraries needed and set the random seed to a constant value in order to achieve an identical performance of our model in every different training.
import pyodbc
import numpy as np
import pandas
import matplotlib.pyplot as plt
from keras.models import Sequential
from keras.layers import Dense
np.random.seed(101)
It is the part where we define all of the Dremio parameters: host - default ‘localhost’, port - default ‘31010’, username and password of your local Dremio and ODBC Driver path. Then we will create a connection to Dremio.
host='localhost'
port=31010
uid ='username'
pwd = 'password'
driver = '/opt/dremio-odbc/lib64/libdrillodbc_sb64.so'
cnxn = pyodbc.connect("Driver={};ConnectionType=Direct;HOST={};PORT={};AuthenticationType=Plain;UID={};PWD={}".format(driver,host,port,uid,pwd),autocommit=True)
Now, let’s create the query and write the result to pandas DataFrame. Displaying the five rows.
sql = 'SELECT * FROM Diseases.diseases_new'
dataframe = pandas.read_sql(sql,cnxn)
dataframe.head()

As we can see, the data is loaded correctly and is ready for processing.
It will be useful to visualize the output column ‘Outcome’. Let’s see the distribution of its data. For visualizing we are using matplotlib library.
dic = {'0':len(dataframe[dataframe['Outcome'] == '0']) / len(dataframe),
'1':len(dataframe[dataframe['Outcome'] == '1']) / len(dataframe)}
plt.bar(dic.keys(), height=dic.values(), width=0.6)From this bar we can see that there are about 65% of patients that don’t have diabetes, and 35% that do.
Then we are going to create numpy array from our data and create our X features and Y labels.
dataset = np.asarray(dataframe.values)
X = dataset[:,0:8]
Y = dataset[:,8]
So, we have created our training datasets. We are not going to create a test dataset, because data is very small and the model will be developed for educational purposes only. Now, let’s create, compile and train our model. We will be using Sequential model with three layers and Sigmoid activation function as output.
Create Model
model = Sequential()
model.add(Dense(32, input_dim=8, activation='relu'))
model.add(Dense(16, activation='relu'))
model.add(Dense(1, activation='sigmoid'))
Compile Model
model.compile(loss='binary_crossentropy', optimizer='adam', metrics=['accuracy'])
Train Model
hist = model.fit(X, Y, epochs=150, batch_size=10)
Visualize Model Accuracy
plt.plot(hist.history['acc'])
plt.title('model accuracy')
plt.ylabel('accuracy')
plt.xlabel('epoch')
At the plot above you can see how model’s accuracy increased over the number of epoch. Now, let’s evaluate our model to see how good it is in prediction.
Evaluate the Model
scores = model.evaluate(X, Y, verbose=0)
print("\n%s: %.2f%%" % (model.metrics_names[1], scores[1] * 100))
Output:    acc: 75.92%
We have got pretty good accuracy with this simple model.
Conclusion
In this tutorial, we showed the possible way to access Apache Hive data with Dremio. It can be easy to load, and perform some data curation, for example, filter data directly in Dremio with the user-friendly interface. Also, we showed how to develop your own machine learning model with Keras, accessing the data from Dremio. As the result, we have got good accuracy on our training set.
Sign up for AI Ready Data content