11 minute read · August 31, 2022
Building a Tableau Dashboard Directly on the Data Lake with Dremio
· Developer Advocate, Dremio

Traditional Approach to BI
As a BI engineer, you are tasked with developing a new dashboard for the revenue unit of your organization. You have all the wireframes defined, had discussions with the business stakeholders to understand the key metrics, and all you need is access to the data to start working on it.
Traditionally, your organization’s data flow architecture looks something like this:
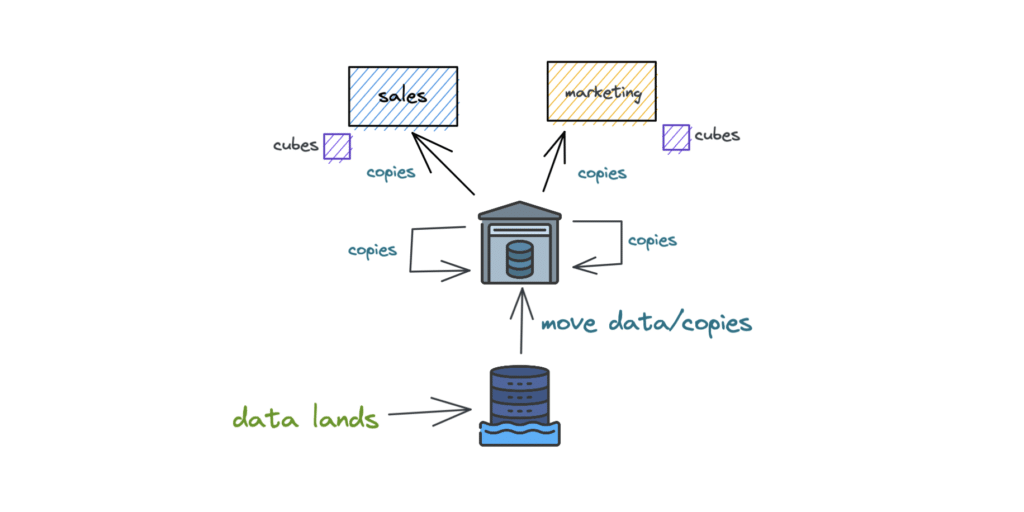
Your company’s data first lands in a cloud data lake such as Amazon S3 (the bottom). Then you submit a ticket for the data engineering team to help move the data for your reporting. Based on the workload of your data engineering team, at some point they will move the data via ETL pipelines to a data warehouse. You need access to multiple databases within the data warehouse, so you make another request to get that data. And finally, a data copy request is made for the business unit specific to your analysis.
Imagine you have to run your analyses on a dataset with millions of records. You also have to consider the performance aspect of the dashboard. So, you might create some cubes or extracts depending on the BI tool you plan to use, resulting in additional data copies. This is not an unusual way of working. In fact, a lot of BI engineers can relate to this scenario.
So what are the problems with this approach?
Here are some of the non-trivial ones that are relevant to this blog:
- Data requests take a long time: Depending on the availability and workload of the engineering team who builds ETL/ELT pipelines, this will vary. This ultimately impacts the time to insight for the organization and the analysis may no longer be relevant.
- Lots of data copies: While the traditional idea of storing data centrally in a data lake and making data copies for moving relevant data to a warehouse and upstream BI tools made sense, it results in many unmanageable copies of data and issues such as data drift, KPI drift, etc.
- Broken ETL pipelines: With so much data movement among systems, ensuring every ETL pipeline runs smoothly and aligns to the best software engineering practices is hard. No one likes an overnight ETL job failure negatively impacting all your reports and models.
- Data in closed formats: When data moves from data lake storage to a data warehouse, you essentially lock-in data to a vendor-specific format and will mostly need to use the same vendor’s engine to process the data. While this may sound good for some organizations, with the changing needs of a fast-moving company, this can become a limitation. Further, it cannot address future use cases such as machine learning (ML).
While the traditional way of working with ETL pipelines and data copies is the norm, there is a new and better approach that bestows some significant advantages to BI engineers and organizations as a whole.
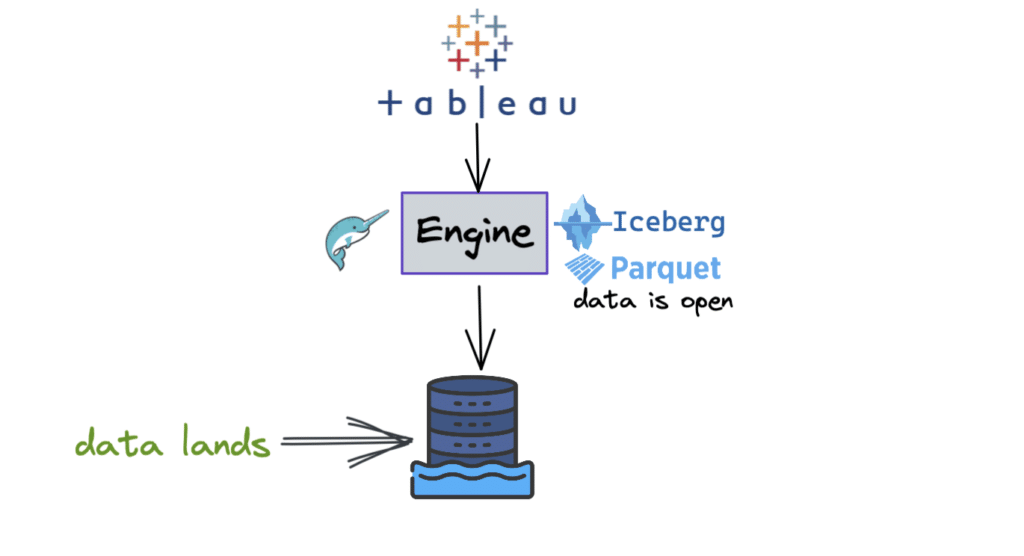
It’s likely your organization stores most of its data in a cloud data lake, so why not use a BI tool like Tableau directly on the data lake? You may be asking:
- Can we do that, and if so, how?
- What about the performance?
This is where Dremio comes in. It is an engine for open lakehouse platforms that provides data warehouse-level performance and capabilities on the data lake. It sits between the data stored in a data lake and the client engine (as shown in the image above). In addition, Dremio enables native connection with BI tools such as Tableau to operate directly on the data lake in live query mode. And most importantly, it is super fast and comes with a free standard cloud edition.
Tutorial
Let’s walk through a quick tutorial to demonstrate how fast it is to build a dashboard in Tableau using the data stored in our data lake.
- Sign up for Dremio to get started with the free edition.
- Load the dataset into Amazon S3. This tutorial uses a dataset based on the data of Kaggle’s H&M Personalized Fashion recommendations. The data is stored in an open file format, parquet as seen below.

- Now let’s access the dataset from Dremio. You can see all your data sources in the “sources” section (highlighted below). The data lake “test” is basically the S3 source where our data resides. On the right, you can see the Parquet file.
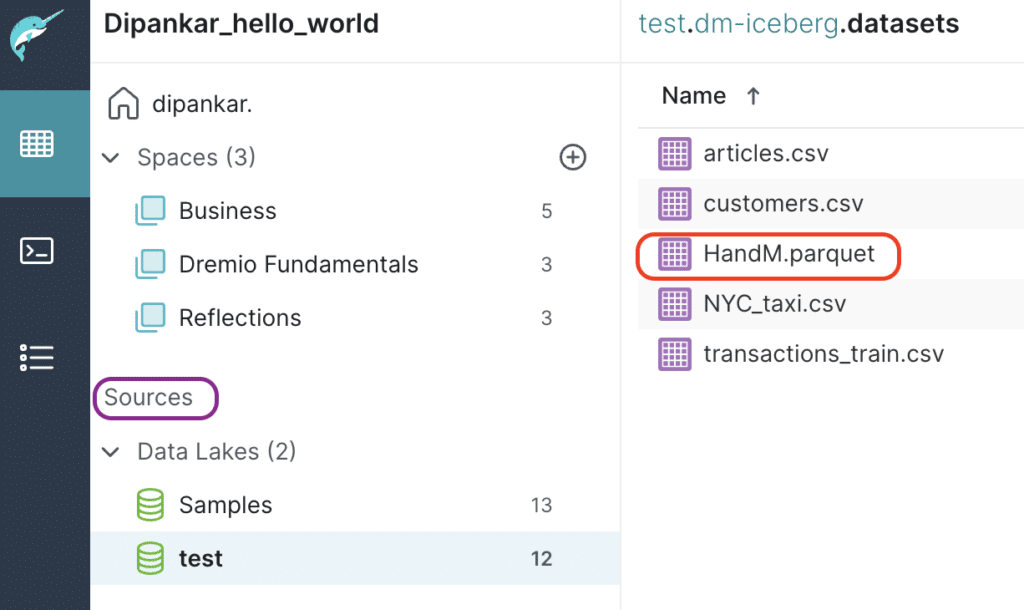
- Let’s click on the data file. Dremio will present you with an interface where you can get a preview of the dataset, run queries, join datasets, create new fields, etc.

As seen in the snippet above, there is a preview of our dataset and all the available options.
- To build the dashboard in Tableau and perform your analysis on the data lake’s data, Dremio allows you to connect directly from the UI. Click on the Tableau icon as shown below.

This action will download a small Tableau data source (TDS) file. Note that this file doesn’t contain any data but rather the information necessary to connect to the actual data. This file will help us authenticate Tableau with Dremio and provide a seamless experience.
- Once we enter our credentials, the connection should be established and ready for our dashboard in Tableau.
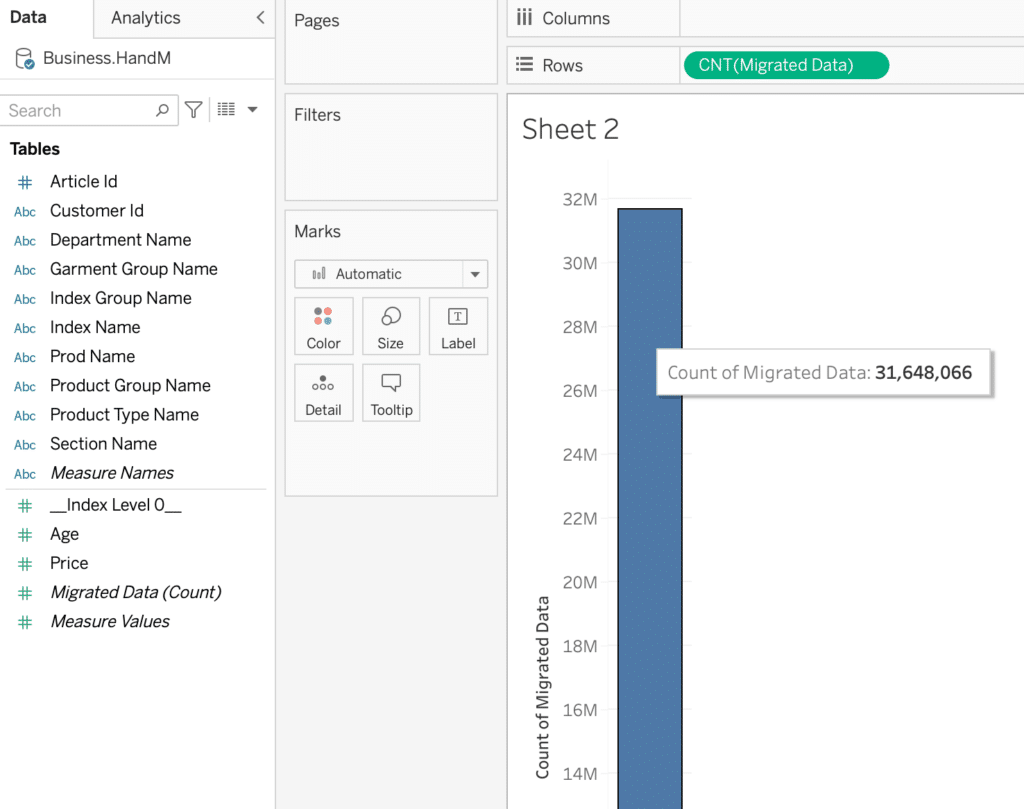
To have an idea of the total number of records in this dataset, let’s drop the “Migrated data (Count)” field under Rows in Tableau. The figure above shows that we have close to 32M records.
- Now, we want to analyze the average price per product group in this H&M dataset. So, we will do an “AVG(Price)” by “Product Group Name.”
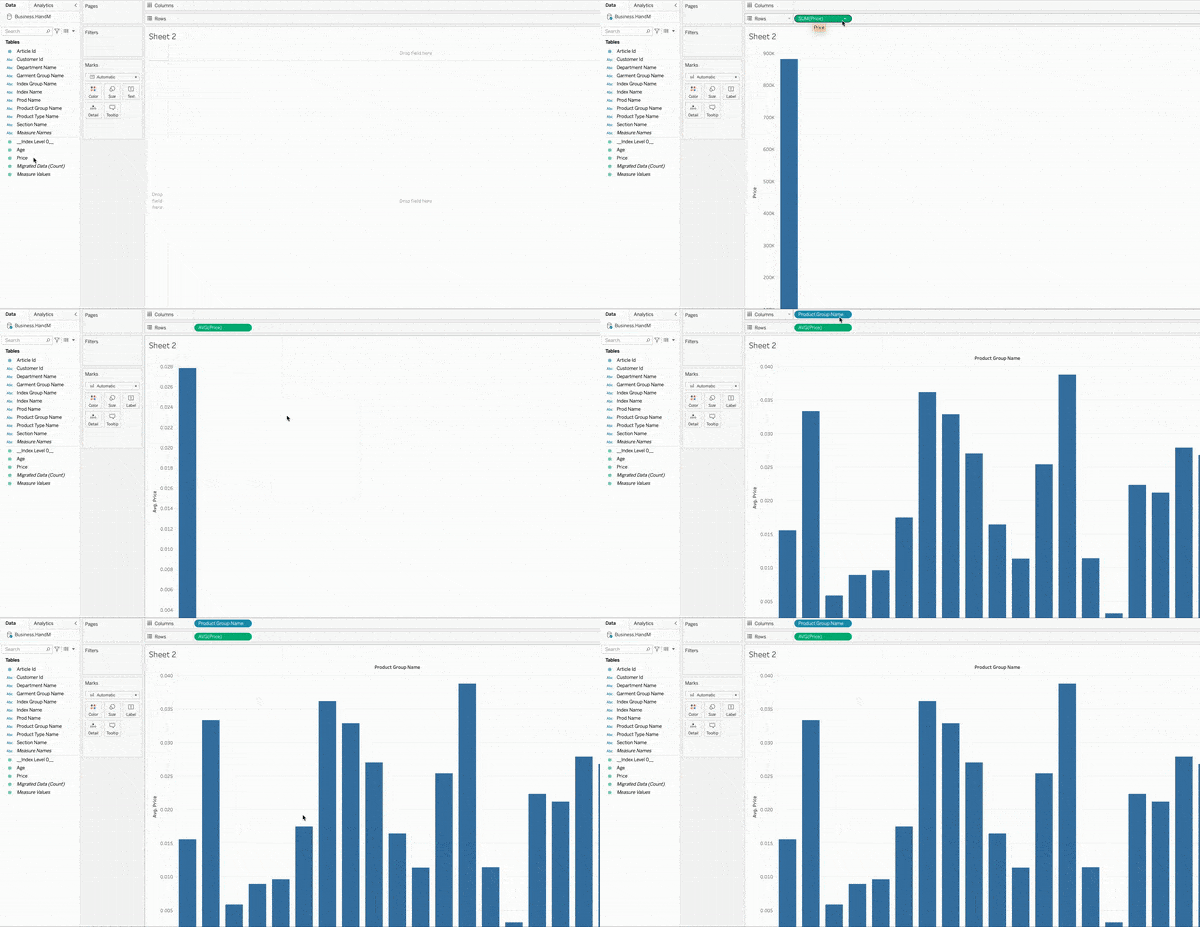
The critical thing to note here is that every analysis that is run in Tableau is actually a live query back to Dremio. Recall that Dremio sits in between the data lake and the client. It takes the query for this million-row dataset, processes it, and returns the result to Tableau in sub-seconds. The GIF above illustrates how fast it is to do this on the data lake directly. Dremio achieves sub-second performance using a feature called data reflections.
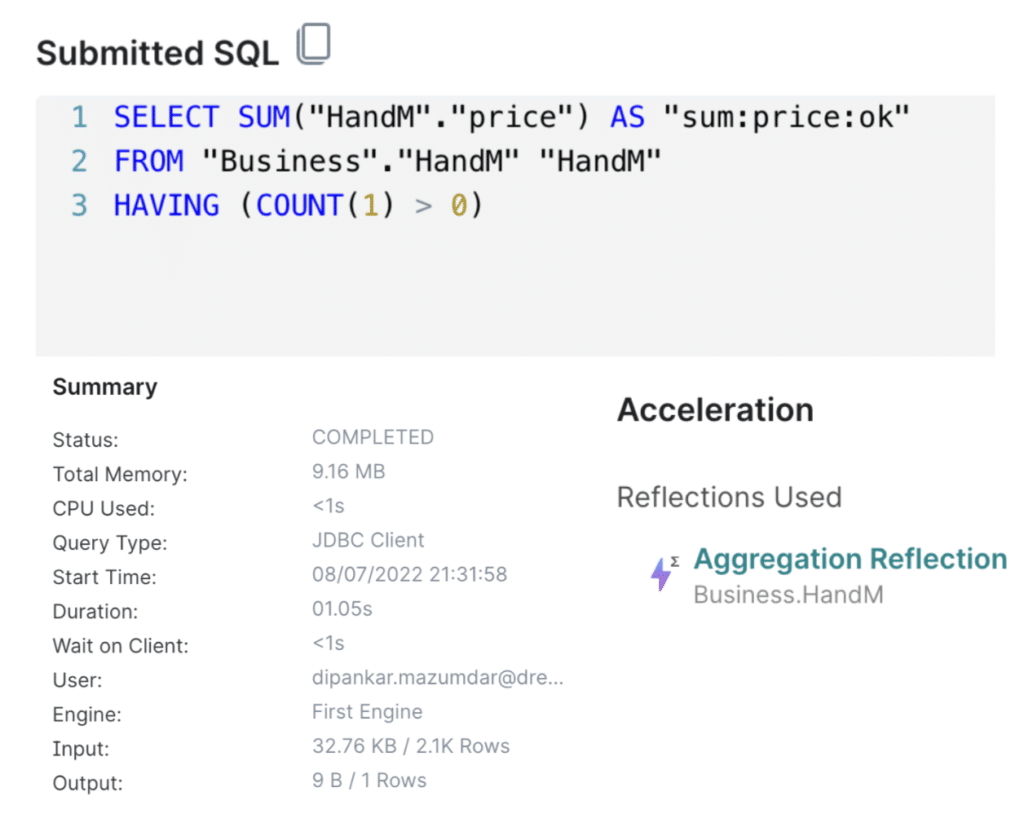
- To understand what query was run and what happened underneath, Dremio keeps a list of all the jobs in the “Jobs” page (shown below).

- Now, if you open one of the jobs, you will be presented with details such as the query executed, a summary of the query run, accelerated queries (reflections), etc., as shown below.
After adding some more analysis, our final dashboard looks like the following:
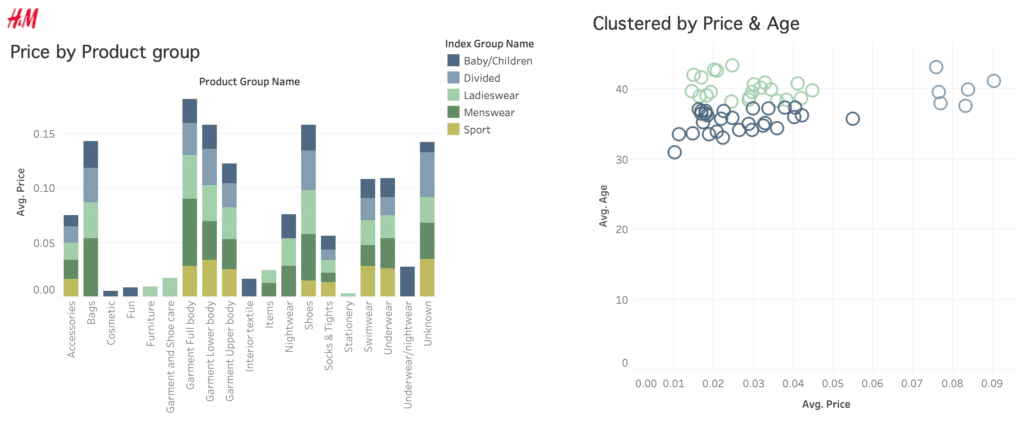
Dremio provides a new way to deal with some of the challenges of traditional data architectures. It mitigates the wait time on the part of an analyst/scientist, helps reduce data copies (when you can), and provides amazing performance while storing data in open formats so it can be leveraged by multiple engines based on the use case. Learn more about connecting Dremio cloud with Tableau here.
Sign up for AI Ready Data content
