26 minute read · September 1, 2018
Analyzing Data with Python and Dremio on Docker and Kubernetes – Dremio
· Dremio Team
Intro
In this Demo we will cover the different scenarios that you might encounter when trying to deploy Dremio on your containerized environment. We will walk you through the steps of installing a single node version of Dremio directly on your Docker platform as well as multi-node deployment using Kubernetes. Then we will show you how to connect to a local data set and analyze data using Python.
We encourage you to work through this tutorial. The steps that we are about to show, work for Enterprise and Community editions of Dremio.
Assumptions
This tutorial has been developed on Mac OS High Sierra and assumes that you have covered the “Getting Oriented on Dremio” tutorial and have the following requirements already set up:
- Java 8
- Docker
- Kubernetes (it comes built-in with the latest Docker-for-desktop release)
- Kubectl
- Helm and Tiller
- Python
- Jupyter
- Pyodbc
- Dremio ODBC Driver
To ensure the best user experience, please do not proceed until the elements listed above have been set up successfully.
The Process
Deploying Dremio
This install will be done using Docker on Mac OS High Sierra. The first thing that we need to do, is verify that Docker is up and running. There are different ways to do this:
If you are working with Docker-for-desktop, the icon on the desktop toolbar should provide a general status.
Normally, I would suggest installing “Minikube”, a tool that makes it easy to run Kubernetes locally. Minikube runs a single-node Kubernetes cluster inside a VM on your laptop. You can still do that, however, the latest version of Docker-for-desktop comes with built-in Kubernetes which will save you some machine resources and make your life easier down the road.
To enable the built-in Kubernetes instance, simply navigate to the Docker preferences and enable it:
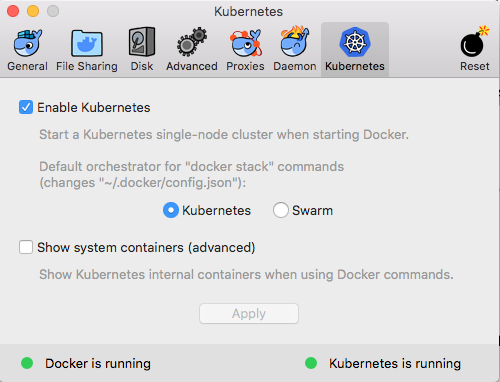
Additionally, make sure to change the context of Kubernetes so it allows you to interact directly with your Docker-for-desktop, like so:

To verify that everything is up and running, simply check the toolbar menu for Docker. The two green lights at the top of the menu means that we are good to go.
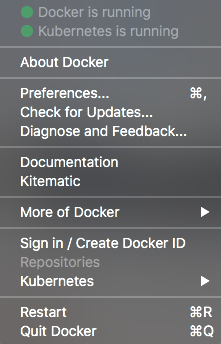
Alternatively, on a new Terminal, run the >docker –version command. It should return something similar to this:

Now lets go ahead and run a single node deployment of Dremio using the following command:
docker run -p 9047:9047 -p 31010:31010 -p 45678:45678 dremio/dremio-oss
This will start Dremio as a daemon, when you close your terminal it will shut down the Dremio instance. To avoid this, let’s stop the daemon by issuing CTRL+C on your terminal window and start the Docker container.
First, list your Docker containers using the following command:
docker ps -a
If everything has been deployed correctly so far, the result should be similar to the following:

Now let’s go ahead and start the Docker container, this will initialize Dremio. To do so, you can issue the “>Docker Start [CONTAINER ID]” or “>Docker Start [Container Name]” command. In this case Docker assigned “amazing_curie” to my Dremio deployment so we will use “>Docker Start amazing_curie”.

Be aware that Docker will only provide the name of the container as feedback when the command is executed, nothing else. If you would like to see the logs issued by this particular container, you can issue the following command:
docker logs [Container ID or Container Name]
Or if you wish to access the logs interactively, open a new shell and issue the following command:
docker exec -it [container name] bash
At this point Dremio should be up and running, we can verify that the container is active by issuing the “docker ps -a” command.

If you have several containers running, you can identify the newest one by the “Status” field. In this case Docker is telling us that the “amazing_curie” container has been up for 4 minutes.
Now, let’s head out to your favorite browser and give Dremio a try. By default and in accordance to the deployment made on this scenario, Dremio will be available at:
If everything has gone well so far, you will be presented with the following welcome screen:
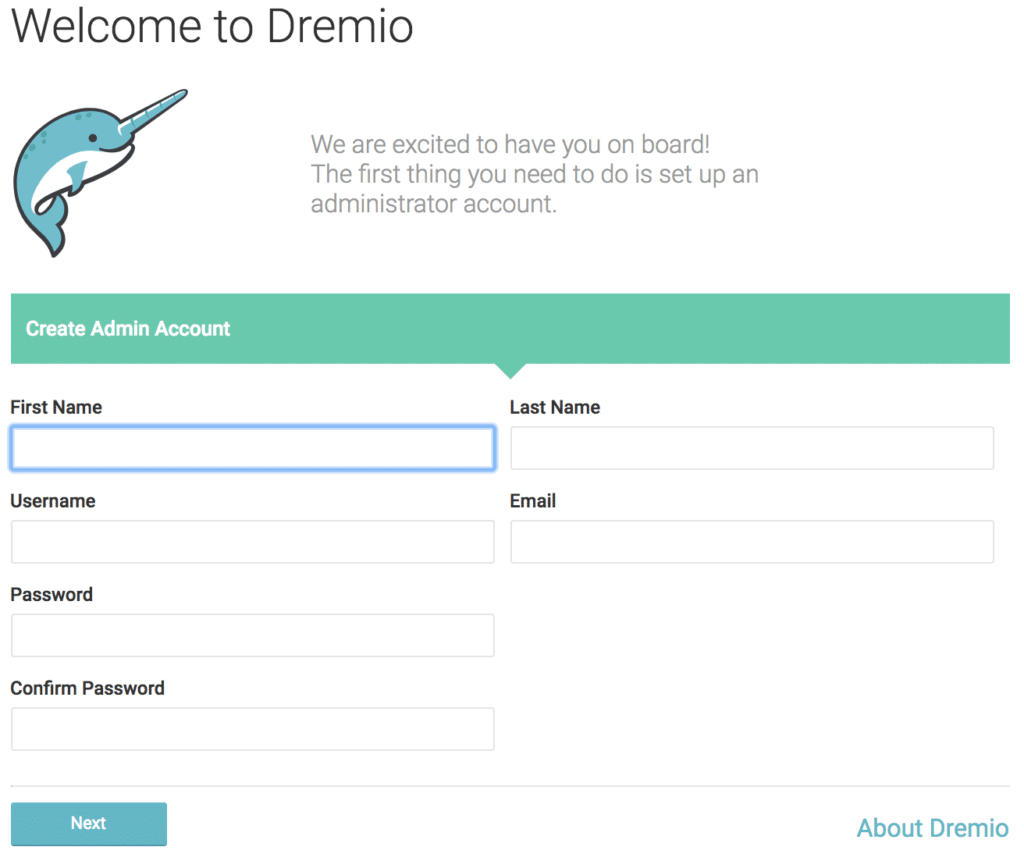
Simply fill in the form to access Dremio and you will be good to go. Once you log into the Dremio UI, if you want to verify the status and details of your deployment, navigate to the “Admin” menu and select “Node Activity”.

Since this is a single-node deployment, the Coordinator and Executor will be located under the same instance.
Up to this point, you have successfully completed a single-node deployment of Dremio. At the beginning of this article, I mentioned that I would also cover deploying Dremio on Docker using Kubernetes. Let’s go ahead and see how this is done.
To deploy Dremio using Kubernetes, we will need to make sure that Helm and Tiller are installed on your environment. There is plethora of information on the internet about how to get a Kubernetes cluster going, however we will give you a quick summary of what needs to be set up before we deploy Dremio. If you haven’t done so, these few steps will get you going in a short amount of time:
You will need Helm and Tiller; to install Helm, run the following commands:
curl https://raw.githubusercontent.com/kubernetes/helm/master/scripts/get > get_helm.sh
chmod 700 get_helm.sh
./get_helm.sh
To install Tiller run the command bellow:
helm init
helm init --upgrade
To verify that Tiller has been configured successfully, run the following command:
kubectl --namespace kube-system get pods | grep tiller
And you should get the following output:

Now to the fun part, and this is where things get interesting. First, download or clone the Dremio containers that we have made available on Github. Place the unzipped contents on a working directory that you are familiar with. You will notice that the structure of the “Containers-master” is Charts and Images. On this section of the tutorial, we will be working with the “Charts” directory only. Verify that the contents compare to what is listed below:
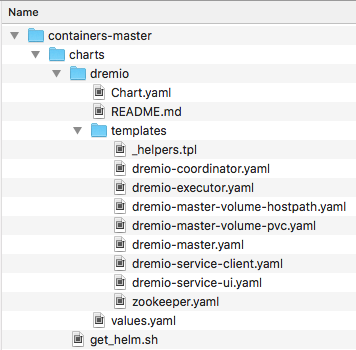
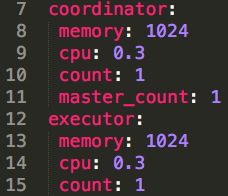
Before we continue, we need to tweak the “values.yaml” file to make sure the deployment can be executed successfully with the resources that we have available on our environment. To do this, open the “values.yaml” file on your text editor of choice and change the coordinator parameters to the following values:
Now navigate to your terminal window and place yourself in the working directory where the “Containers-Master” folder is located, and then CD into charts before running the following command:
helm install --wait dremio
After a few seconds and once everything is ran successfully, you will get the following output

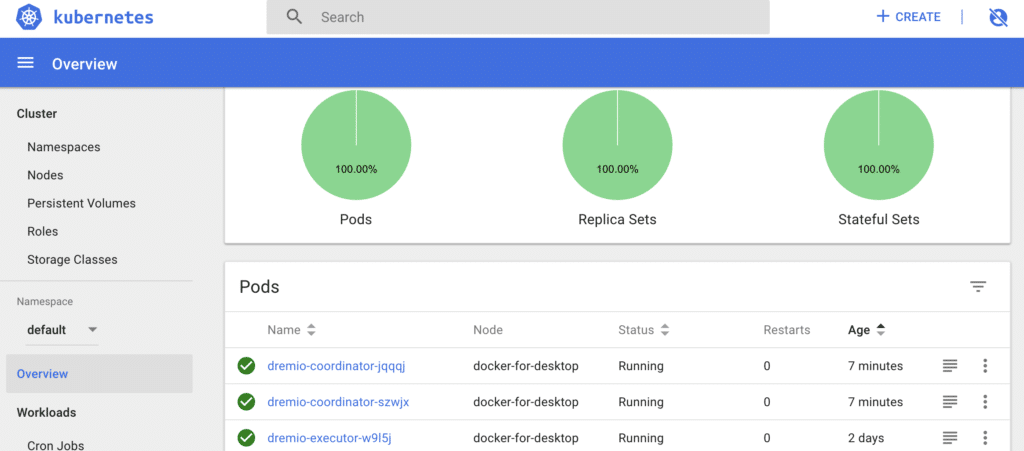
If you would like to dig deeper into the details for the deployment, you can launch a Kubernetes dashboard on your browser. Please be aware that Kubernetes does not have this dashboard installed by default, a few extra steps need to be taken to be able to access it.
Accessing Dremio
To access Dremio, first we need to find out what is the IP address and port that we will use to access the UI. To do this, on a Terminal window type the following commands:
First we need to list the services available in our Kubernetes cluster by issuing the following command:
kubectl get services

Then, we will need to “describe” the service that we need to access, in this case “dremio-coordinator-ui” using the following command:
kubectl describe services/dremio-coordinator-ui
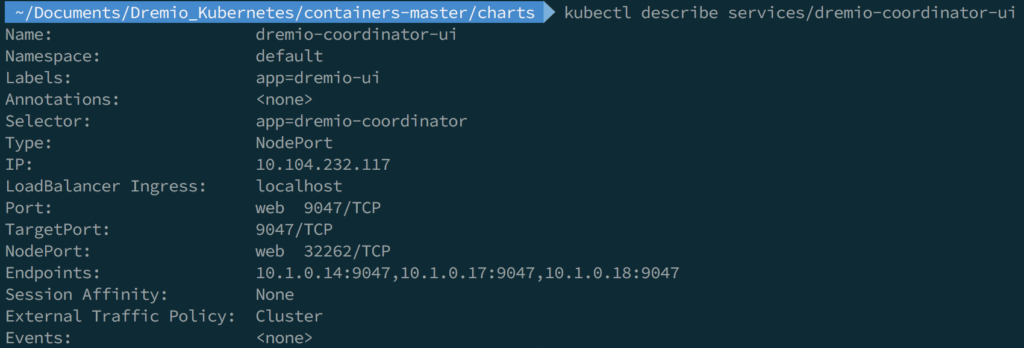
Here we are going to focus our attention on the “loadBalancer Ingress” and “Nodeport” values, this tells us that to access the UI we will need to navigate to: http://localhost:32262 which will present you with the registration screen for your new Dremio instance.
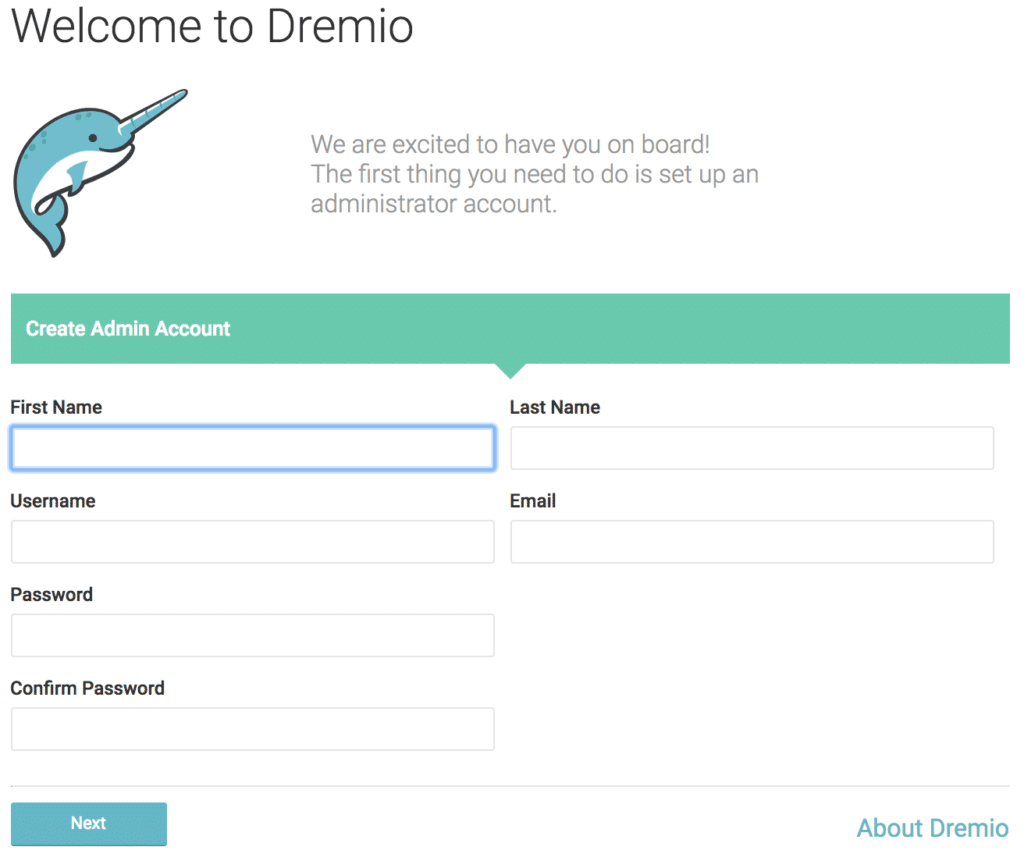
Verifying The Status of The Nodes
After setting up the environment, we can visit the UI once again to check on the node activity. Do this by visiting Admin -> Node Activity. You will be able to see the list of Coordinators (c ) and Executors (e) available in the cluster.

Scaling Your Environment Up or Down
If you wish to scale up your environment by increasing the number of Coordinators or Executors, first you will need to list the releases to identify which one do we want to work with, to do so run the following command:
helm list

In our case, Docker has assigned the name of “enervated-lemur” to our Dremio release; the command to increase or decrease the number of coordinators would be the following:
helm upgrade enervated-lemur --set coordinator.count=3 .
To add additional Executors:
helm upgrade enervated-lemur --set executor.count=3 .
You can scale down the same way. Once the changes are done, you can navigate again to the Node Activity perspective in the UI to verify that the changes have taken effect.
Adding a New Data Set
Great! You have made it this far. In this part of the tutorial, we will now connect to a sample dataset on Dremio, and then we will create a Jupyter notebook and analyze the data using Python.
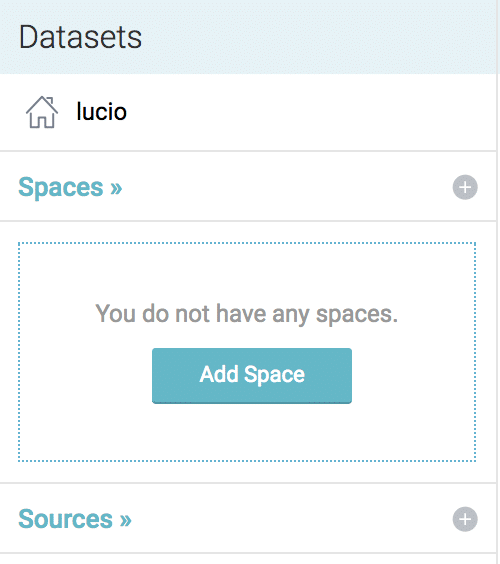
First we need to add a sample data set, we will work with Dremio built-in data set. To add it, simply head over to the “Sources” section and select the plus sign:
From the available list of data sources we are going to select “Sample Source”
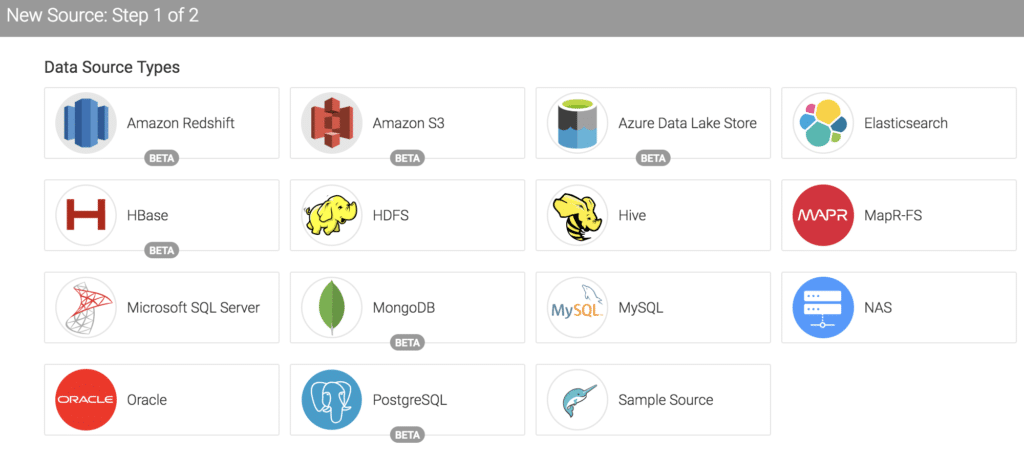
This will automatically add the “Samples” data source to our environment, now to access the data, click on “Samples” -> “SF_incidents2016.json”
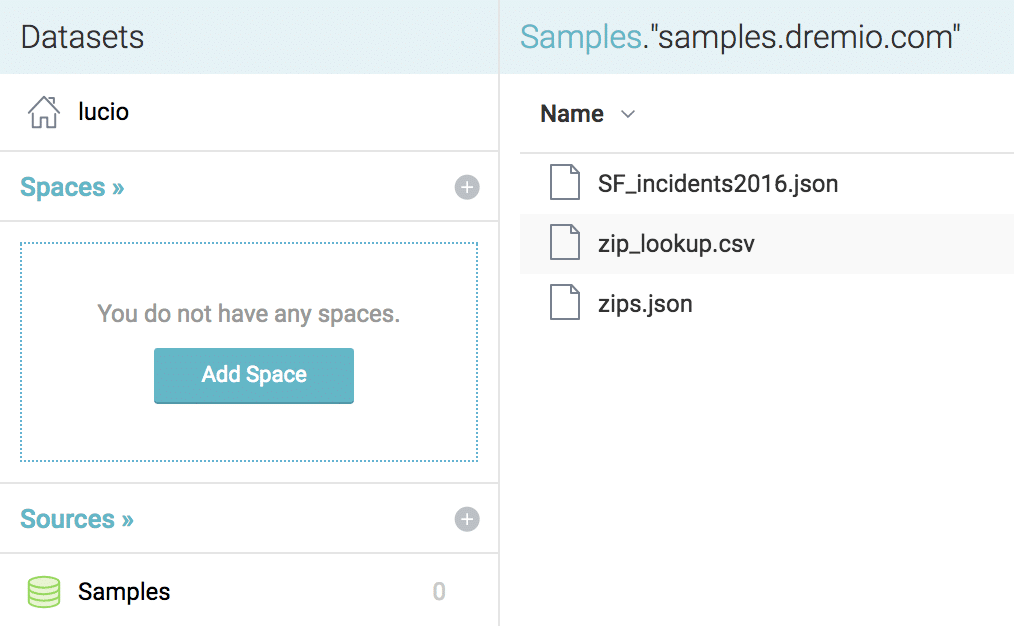
At this point we can go ahead and explore the data to make sure the values and fields are the once that we want to work with.
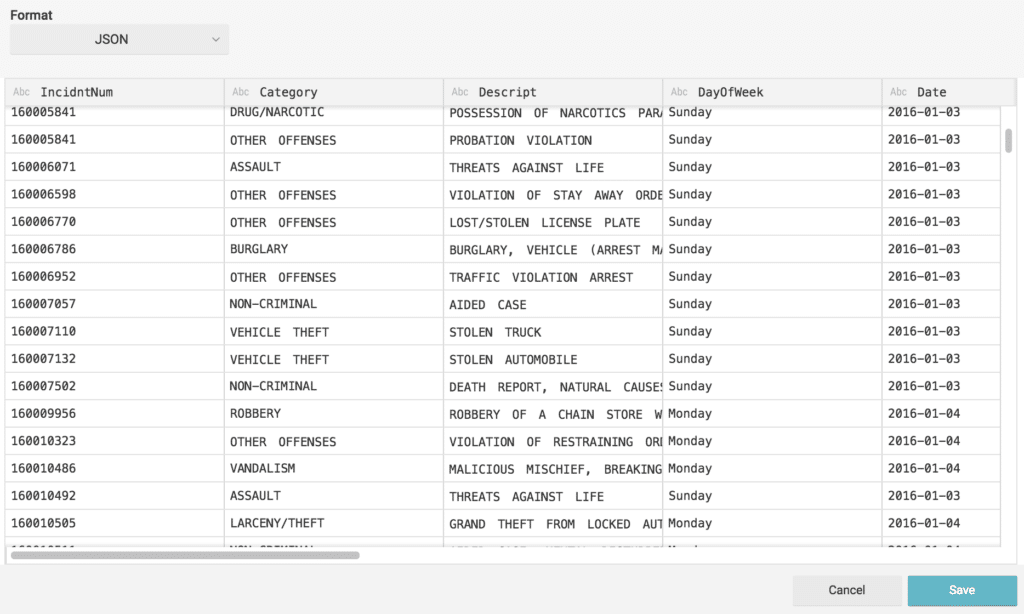
From here, we can simply click “Save”, this action will make the data set available for further curation if necessary.
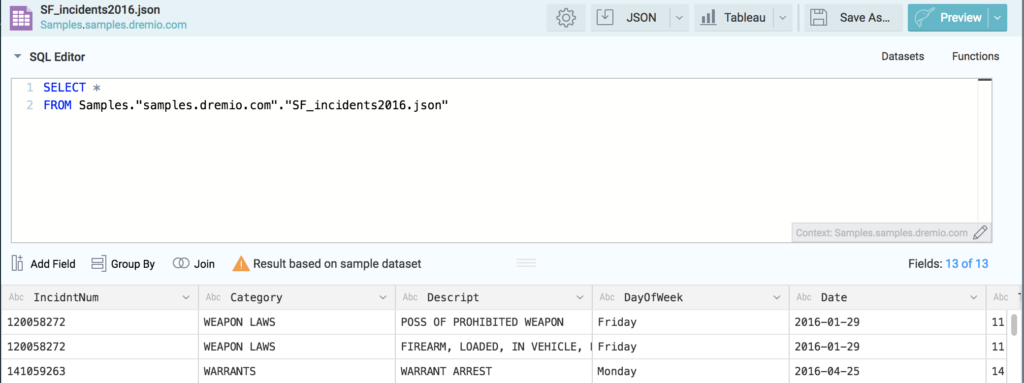
At this point we could go ahead and perform any operations that we would like to on the data set, adding or renaming fields, creating group by’s etc. If you would like to see more detail about the operations that can be done here, feel free to follow our Working with Your First Data Set tutorial. At this point, we won’t make any changes to the data and we will click on the “Save As..” button.
We will give the data set a name, and save it into the default Space.
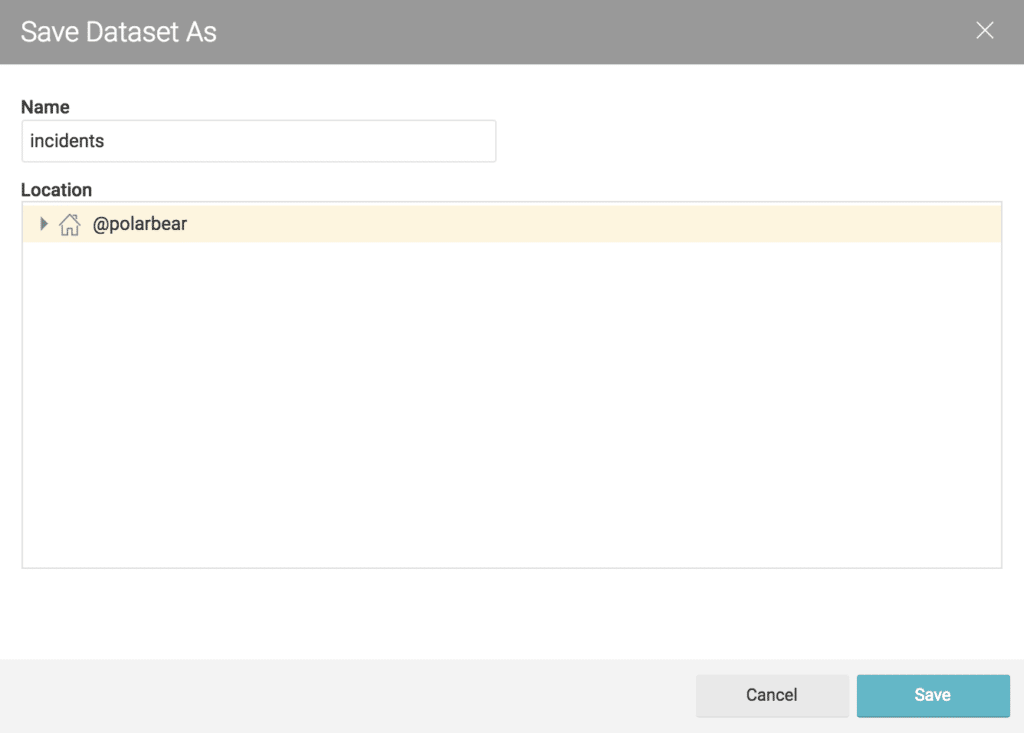
Now we are ready to go and start analyzing the data using Python. Before we move on, we can verify that the data set is available in our Dremio Space.

Accelerating The Data Set
As you know, Dremio utilizes Data Reflections to partially or completely satisfy queries coming from the BI tool that we might be using at the moment. This enhances the performance of the queries by using optimized representations of the data rather than querying the raw data every time a new query is generated.
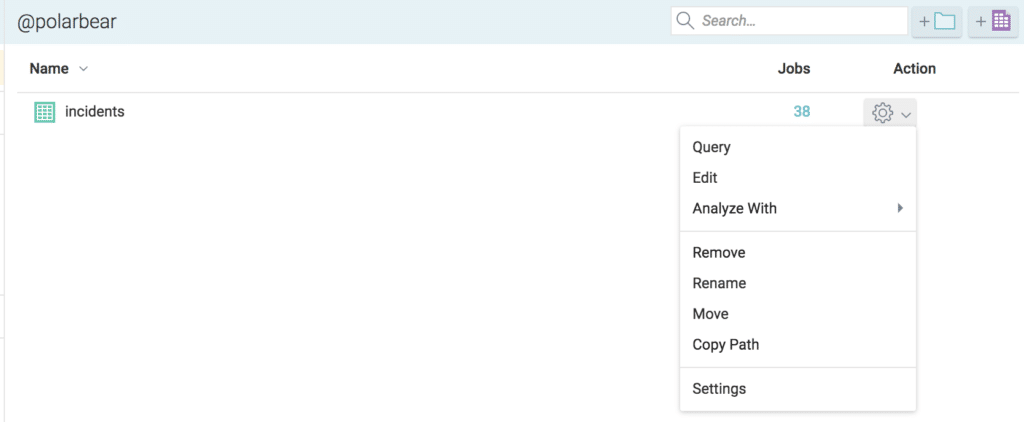
At this point, we can go ahead and opt-in to accelerate our data set by selecting the “Settings” option from the data source menu
Then on the “Dataset Settings” dialog window, we will toggle the “Raw Reflections” option.
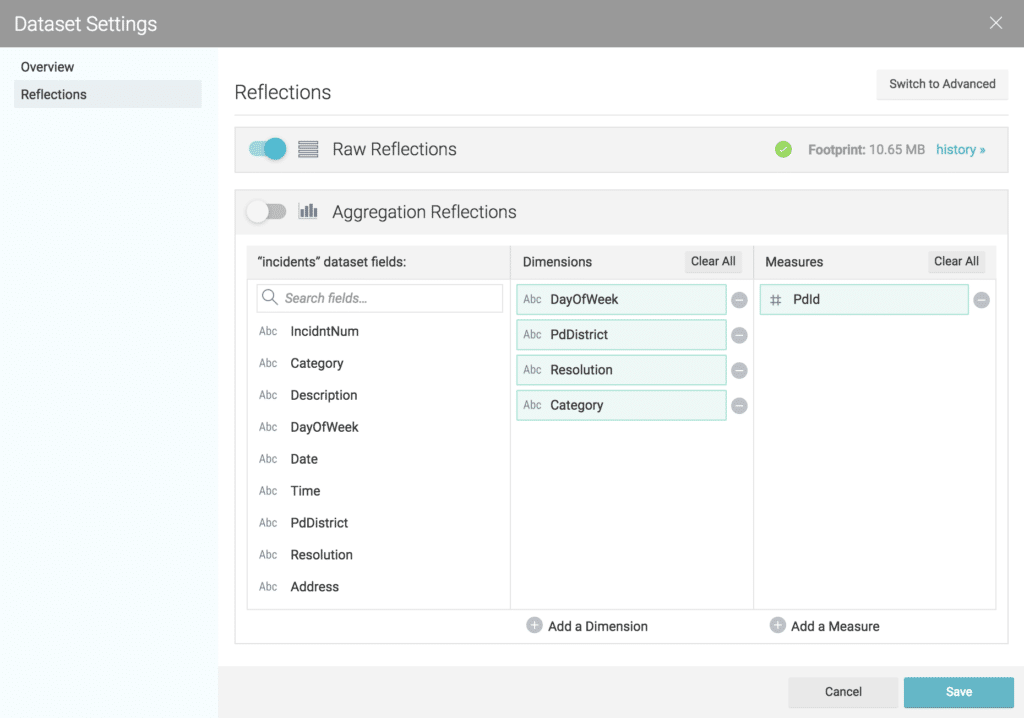
With our “incidents” dataset in our “@polarbear” Space, and the Reflections all set, we can go ahead and start analyzing the data.
Accessing Data From Python
For this section of the tutorial we will go ahead and set up a new ODBC connection from a Jupyter Notebook. Then, we will query the data using SQL and create a simple bar chart to perform some exploratory analysis.
First let’s set up the parameters for our new ODBC connection string:
import pyodbc
host = 'localhost'
port = 31010
uid = 'polarbear'
pwd = 'dremio123'
driver = "/Library/Dremio/ODBC/lib/libdrillodbc_sbu.dylib"
Then we go ahead and build the connection string:
cnxn=pyodbc.connect("Driver={};ConnectionType=Direct;HOST={};PORT={};AuthenticationType=Plain;UID={};PWD={}".format(driver,host,port,uid,pwd),autocommit=True)Next, we follow-up using the Cursor class to execute the SQL query and then we fetch and print the results. To make it easier to read, we will go ahead and use Pandas.
cursor = cnxn.cursor()
sql = '''SELECT distinct category as Category, count(* ) as Incidents FROM "@polarbear".incidents group by category'''
cursor.execute(sql)
response=cursor.fetchall()
if response:
   print(response)
This is a sample the output that this query will generate:
| Category | Incidents | |
| 0 | LARCENY/THEFT | 40409 |
| 1 | OTHER OFFENSES | 19597 |
| 2 | NO-CRIMINAL | 17865 |
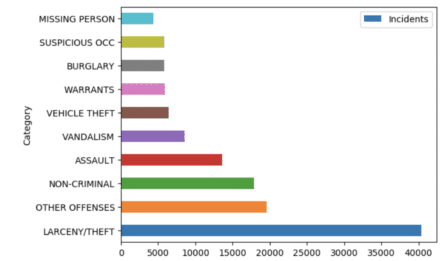
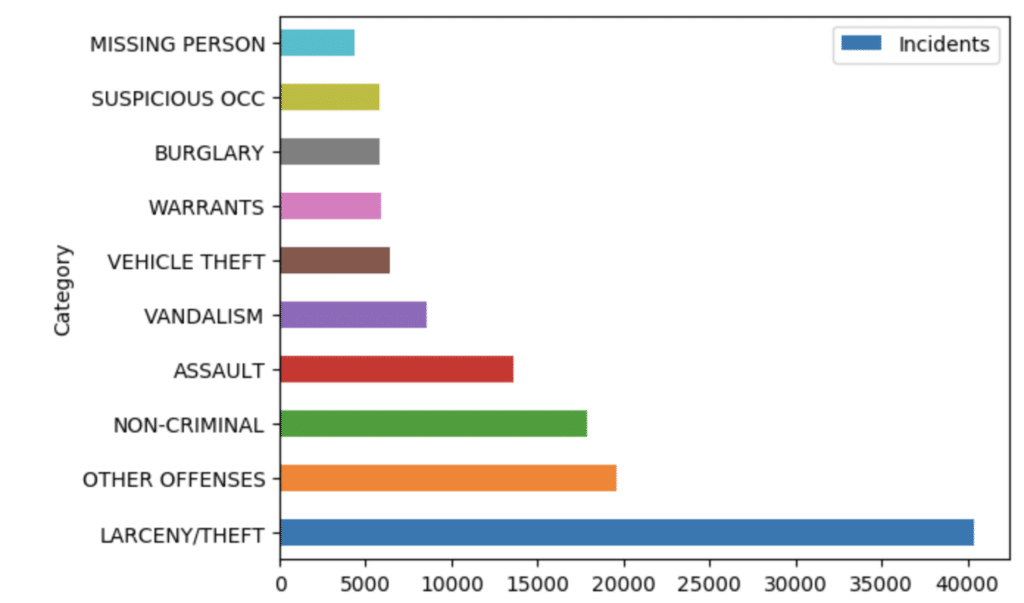
If you want to analyze the distribution of the incidents in a more visual way, all we have to do is tweak the query and plot it in the following way.
import matplotlib.pyplot as plt; plt.rcdefaults()
import pyodbc
import pandas
host = 'localhost'
port = 31010
uid = 'polarbear'
pwd = 'dremio123'
driver = "/Library/Dremio/ODBC/lib/libdrillodbc_sbu.dylib"
cnxn=pyodbc.connect("Driver={};ConnectionType=Direct;HOST={};PORT={};AuthenticationType=Plain;UID={};PWD={}".format(driver,host,port,uid,pwd),autocommit=True)
sql = '''SELECT distinct category AS Category,
        count(* ) AS Incidents FROM "@polarbear".incidents
        GROUP BY category
        ORDER BY Incidents DESC
        Limit 10'''
data = pandas.read_sql(sql,cnxn)
data.plot('Category','Incidents', kind='barh')
plt.show()
The result will show as follows:
Summary
In this tutorial we showed you step by step how it is possible to deploy a single-node cluster of Dremio on Docker. We also walked through the journey of deploying a multi-node Dremio environment on a Kubernetes cluster. Both of this scenarios were executed locally, however similar steps can be taken to deploy Dremio on larger architectures.
Additionally, were were able to connect this environment to a JSON file located in Amazon S3, and then in a matter of minutes started gaining insights from this data through Python. This process was completed successfully without the complexities and overhead costs of writing code of moving data out of your data lake.
Sign up for AI Ready Data content

