12 minute read · May 2, 2022
From Signup to Subsecond Dashboards in Minutes with Dremio Cloud
· Head of DevRel, Dremio

Introducing Dremio Cloud
Have you heard the good news? Dremio released Dremio Cloud, the forever free open lakehouse platform. Incur no software costs or licensing costs and have the power of the Dremio’s lakehouse query engine, Sonar, and its intelligent metastore for Iceberg tables, Arctic. Let me show you how easy it is to get started.
Signing up for Dremio Cloud
To sign up for your free account, go to the Get Started page.
Next:
- Choose whether you want to create an account using the North American or European Dremio control plane.
- Enter your email address
- Click “Sign Up for a Dremio Organization”
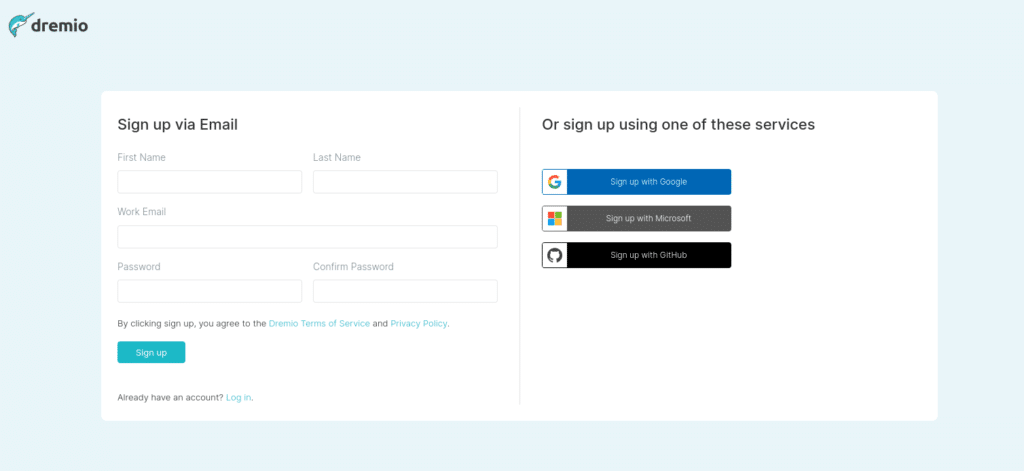
- Create a New Account with your email, or use Google, Microsoft, or GitHub single sign on.
Configuring Your First Project
Now that your account is created you’ll want to configure your initial Dremio Sonar project with your AWS account:
- Select an organization name
- Select a project name
- Select which AWS region to create the project in
- Click Next
- On the next page, configure your cloud connection. The easiest way to do this is via the provided CloudFormation template.

Adding Users and Roles
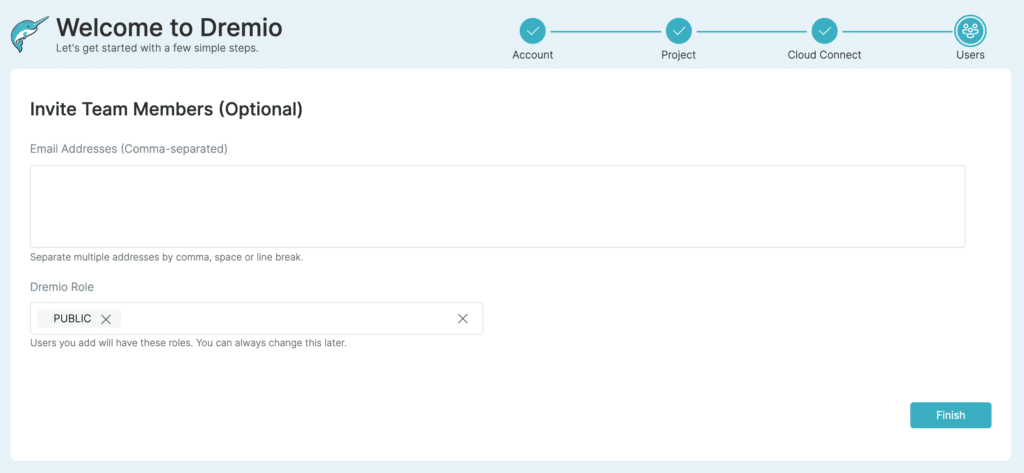
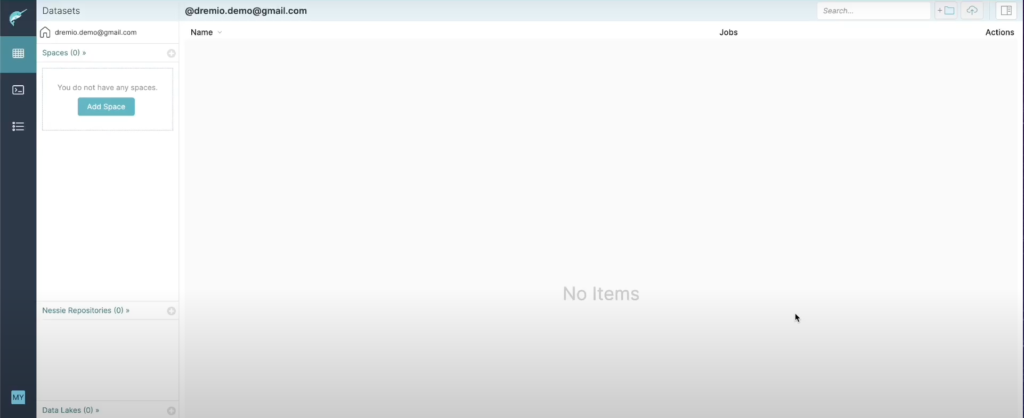
After you are done with CloudFormation you have the optional step of adding additional users and roles to your account. Once complete, click Next and you will be on the dashboard of the Dremio interface.
Add Sample Data
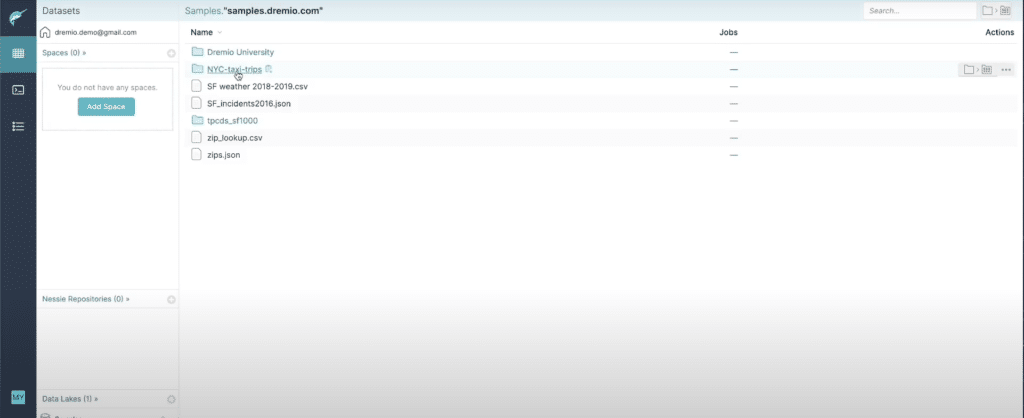
From the user interface, we will want to add sample data to our Sonar project. Click the dd Sample Data button and a new sample source will be added. Next:
- Click on the “Samples” data source
- Click on the “samples.dremio.com” folder
- Next to the “NYC-taxi-trips” folder, click the button to the right to promote the folder to a dataset
- Click Save
Creating a New Column and Saving a Virtual Dataset
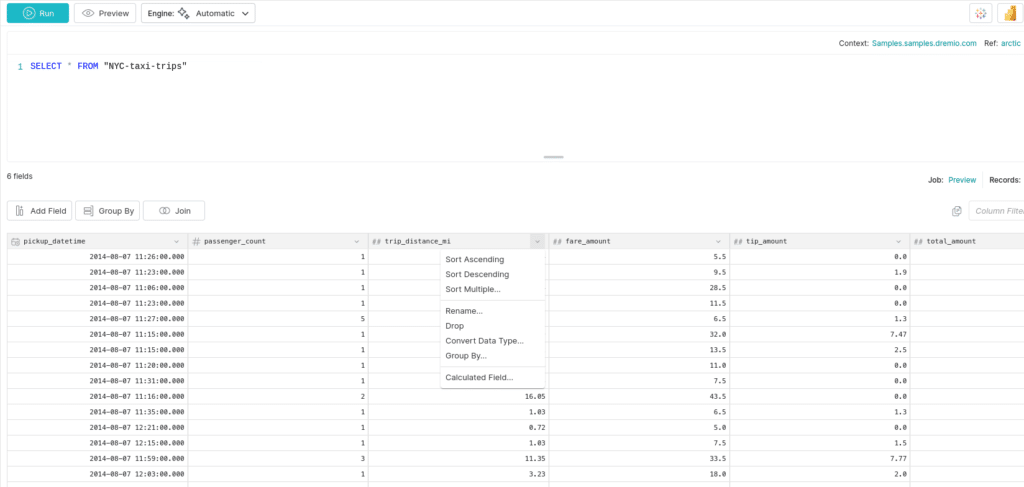
It is easy to curate data for many purposes in Dremio Sonar. Let’s take the field that represents the distance in miles and use it to create a new column to show us the distance in kilometers. To do this:
- Click on the right corner of the
distance_in_mifield to reveal a dropdown and select “calculated field” - On the next screen, let’s multiply the miles field by 1.6 to get the values for our kilometer field (a mile is roughly 1.6 kilometers)
- Uncheck the box to keep the existing miles field
- Click Apply
- Click the dropdown in the upper right and select “Save View As” and name it
NYC-taxi-data - Go back to the main screen and select new View/Virtual Dataset
Creating Data Reflections
Dremio Sonar has many performance capabilities to bring you blazing-fast queries at scale. But we want our queries to be subsecond on our 340 million-record dataset, especially when we’re creating BI dashboards in Tableau. Dremio uses the Data Reflections tool to optimize queries. Reflections automates the optimization of queries on high-priority datasets. To use Reflections:
- Click Reflections in the top nav
- Turn on the toggle next to “Aggregate Reflections”
- Remove
passenger_countfrom the dimension list, leavingpickup_datetimeas the only dimension - Add
passenger_countto the list of measures - Click Save
- Right-click on history to see the clock. When the clock stops, that indicates that the Reflection has been generated.
- Return to the main screen for the dataset

Connecting Tableau
With a few clicks we can connect tools like Tableau to our Dremio account to work directly and performantly with our data lake data, no need for cubes or marts. To connect our sample dataset to Tableau:
- Click on the Tableau logo to download the .tds file
- Open the .tds file to open Tableau
- Once Tableau opens, it will open a new tab in your browser so you can sign on and establish a connection with your Dremio account
- Return to Tableau and you’ll see all your columns from your dataset
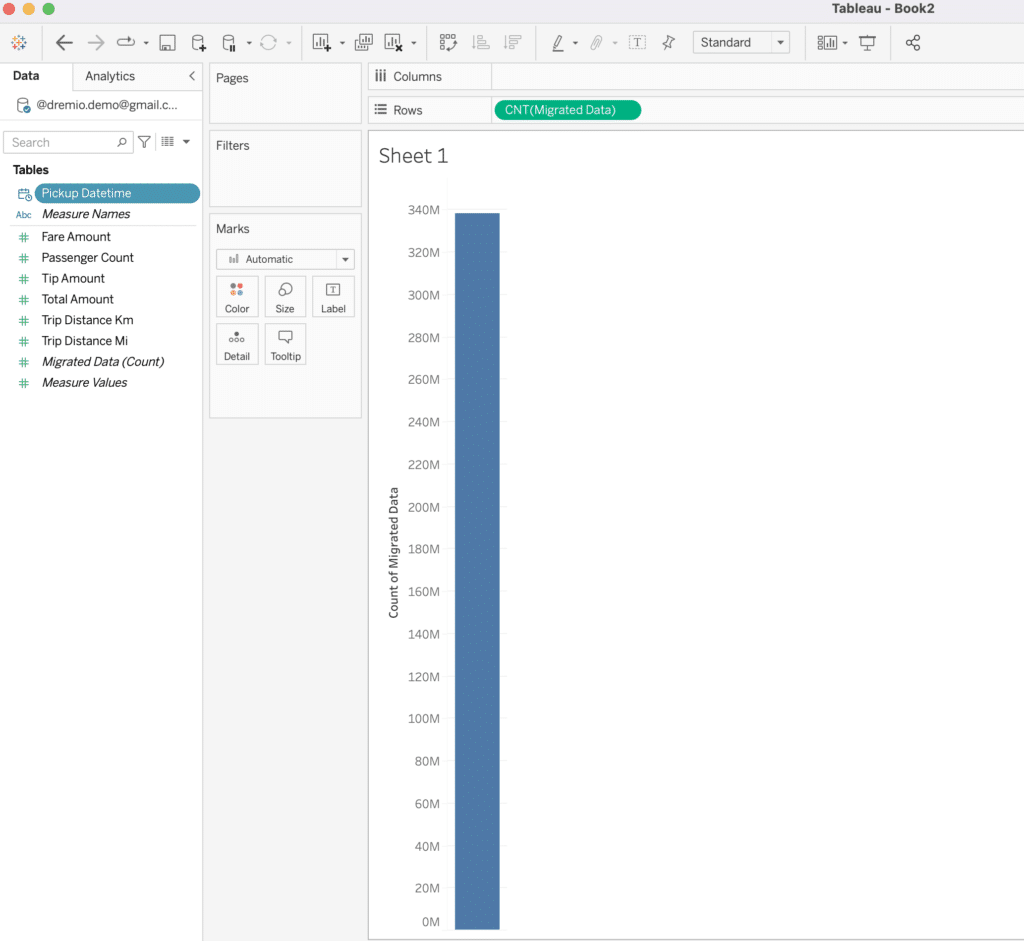
- Move the “migrated_data” field into rows to see a full count of the dataset (this should be about 340 million records)
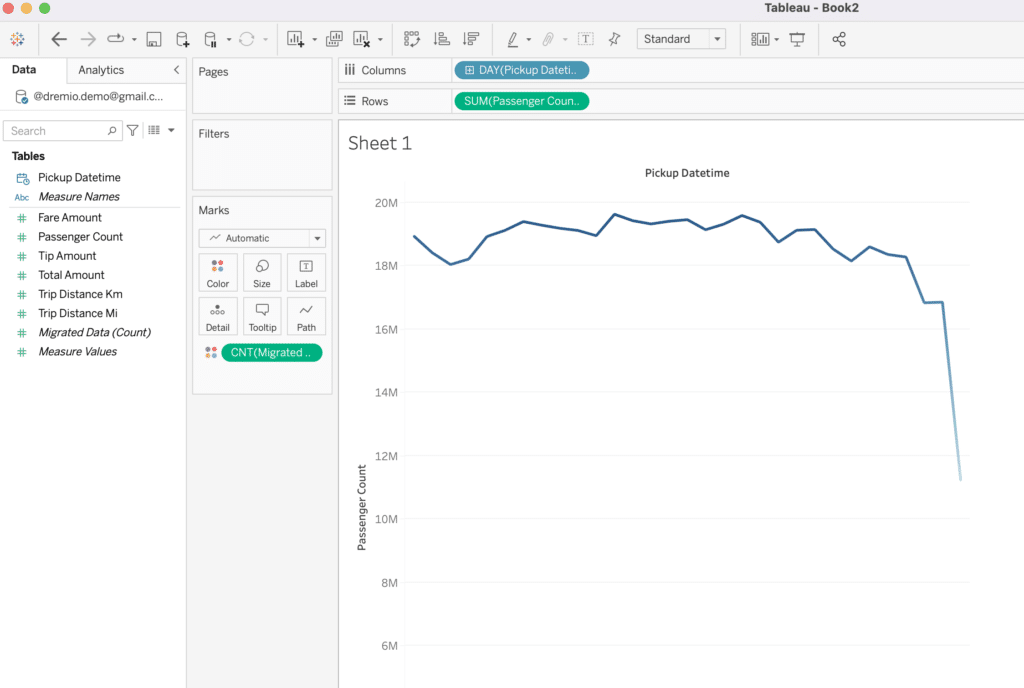
- Remove the field from rows and replace with
passenger_countto see a count of all passengers from every ride. Note that each time we update the rows and columns, it is undergoing a new query on our 340 million-record dataset, which is completing in subsecond times thanks to the Reflection we created earlier. - Move
pickup_datetimeto be a column - Right-click on
pickup_datetimeto change it to measure by days - Go back to the Dremio UI in your browser and click on the Jobs page to see all the queries Tableau sent and how quickly they have completed
Conclusion
Now you’ve experienced how easy Dremio Cloud makes data lakehouse architectures. Within a few moments of signup, you can be performantly querying and discovering insights from the data in your data lake.
Your Dremio Cloud account comes with additional sample datasets that you can use. Also, since you’re running Dremio Cloud in your AWS account, you can connect Sonar to any dataset that’s in your AWS account in Amazon S3 or other sources.
From your Dremio Cloud account you can also try out Dremio Arctic, an intelligent metastore for Apache Iceberg. Just open up your organization settings and create a new project. Look for upcoming articles on getting started with Dremio Arctic.
Sign up for AI Ready Data content

