WEBINAR
How Dremio and Tableau Enable Cloud Data Lake Analytics at InCrowd Sports
Watch this on-demand webinar to learn how InCrowd Sports provides data insights to players, teams and leagues.
Watch WebinarCreate high-performing Tableau dashboards that operate directly on your data lake.

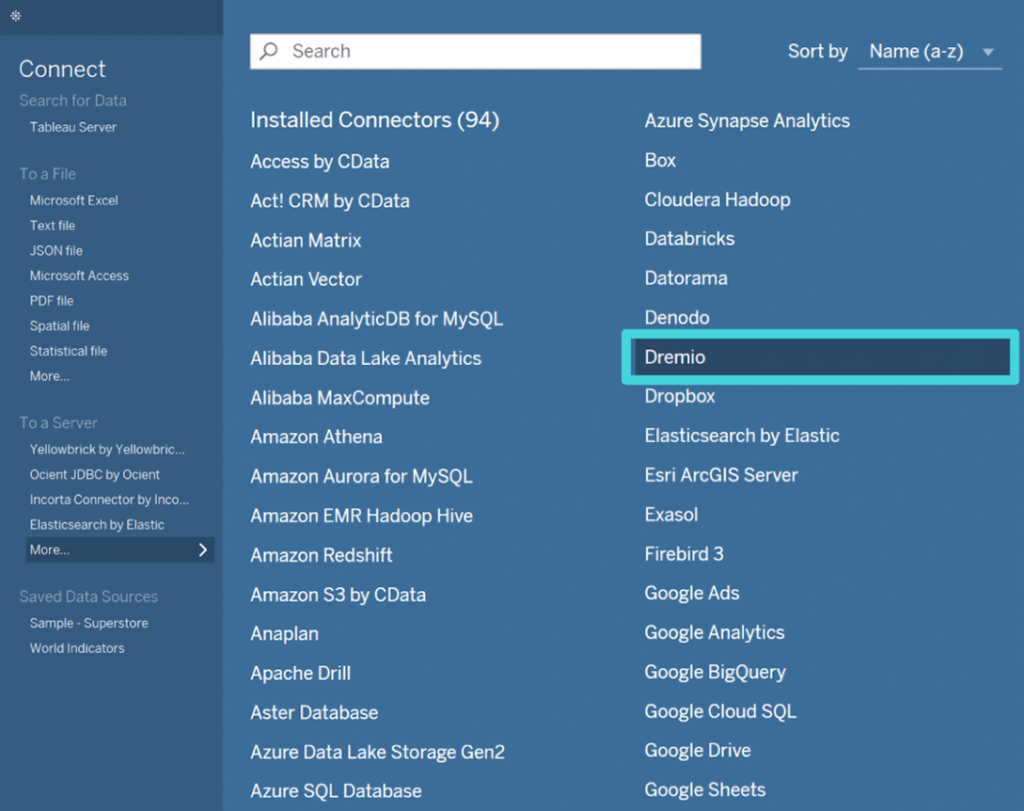
Put data into the hands of consumers — in seconds — with a truly native Tableau connector.
With a simple and intuitive user experience that reduces the number of steps required to connect Dremio and Tableau, users can get business insights, directly from the data lake, into the hands of analysts and business owners quickly and easily.
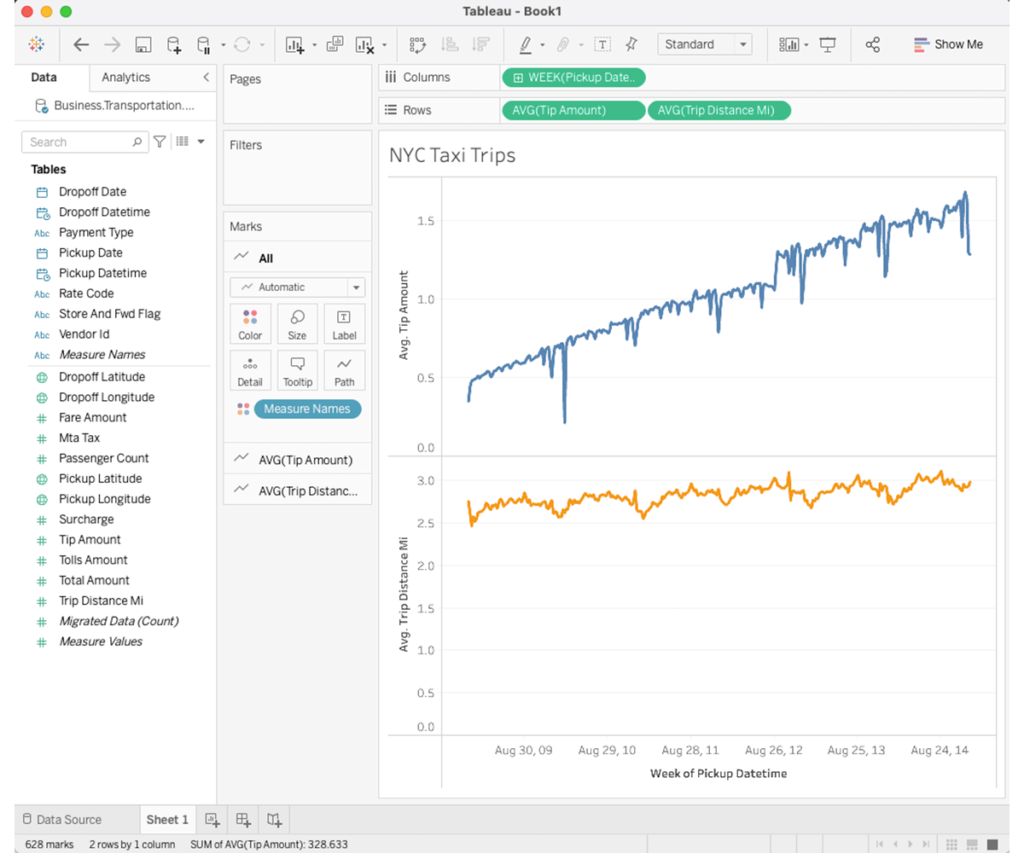
Create interactive, high-performing Tableau dashboards that operate directly on your data lake storage in live query mode. No need to create extracts to get snappy dashboard performance.


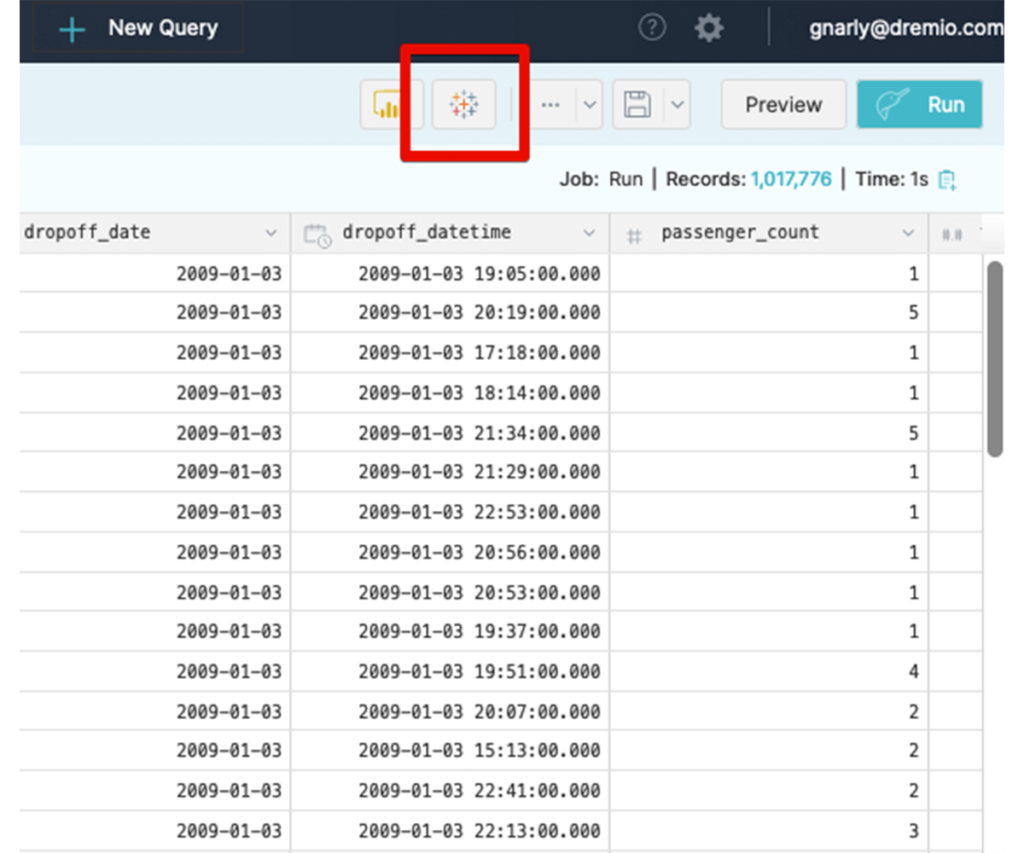
Go from data to dashboard with the click of a button! You can launch Tableau with a live connection to your datasets directly from the Dremio UI.
Execute lighting-fast queries directly on your data lake. Easily deliver data lake security and governance to Tableau users via a single-sign-on connection to Dremio.

Tableau helps people transform data into actionable insights. Explore with limitless visual analytics. Build dashboards and perform ad hoc analyses. Share your work with anyone and make an impact on your business. From global enterprises to early-stage startups and small businesses, people everywhere use Tableau to see and understand their data.

Watch this on-demand webinar to learn how InCrowd Sports provides data insights to players, teams and leagues.
Watch WebinarExplore tutorials such as "Visualizing Your First Dataset with Tableau," "Integrating Tableau with Amazon S3," "Analyzing Azure Data Lake Store and Tableau," and more.
Read TutorialThe “last mile” in many data analytics jobs is the application of a BI or visualization tool. Pictures are powerful and can help to illustrate patterns or summarize data. This tutorial uses Tableau to visualize a dataset created in Dremio.
Read Tutorial