An Iceberg Kafka Connect sink writes Kafka records into Iceberg data files and commits them through a catalog. With Polaris, the connector uses Iceberg's REST catalog interface and Polaris OAuth for table metadata and authorization. In production, you must align topic-to-table routing, schema evolution, commit frequency, dead-letter handling, storage credentials, and maintenance. Connector health metrics alone do not prove that table snapshots are advancing, so include catalog-aware checks and snapshot progression monitoring.
Why this guide, and what changed from the Nessie-era workflow
This article is a current implementation guide for using the Iceberg Kafka Connect sink backed by an HTTP REST catalog, and for integrating that catalog with Apache Polaris authentication and authorization. It replaces workflows that used a Nessie-based catalog or direct filesystem commit patterns. The approach here writes data files, then uses the Iceberg REST Catalog to commit metadata, and depends on Polaris for catalog access and OAuth tokens. I show concrete configuration examples, worker plugin setup, routing, health checks, and operational checks that catch the failure modes Nessie-based flows hid.
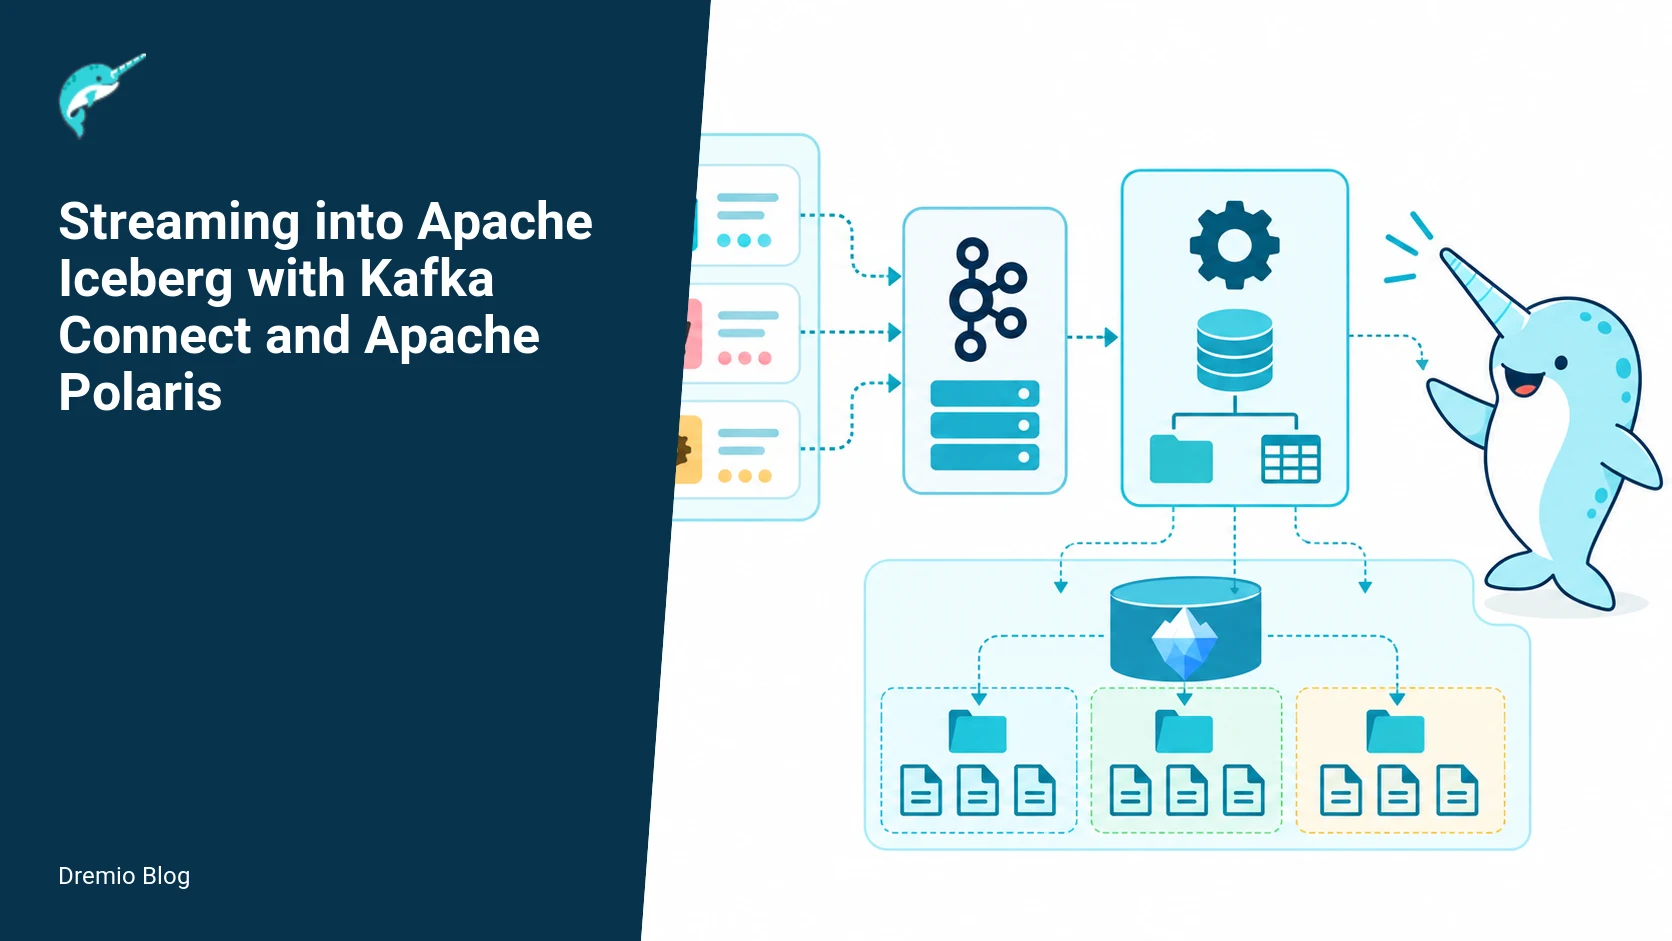
High-level architecture and commit path
At runtime, the connector converts Kafka records into Avro or Parquet files, stages them on object storage, and then requests the REST Catalog to create or update table metadata entries. Polaris sits between the connector and the catalog, enforcing access and providing OAuth tokens. The commit path matters for troubleshooting: file upload, metadata write, and authorization can each fail independently.
Kafka to Iceberg commit path. Each stage has a result that can be checked before the next stage begins.
Commit path steps
Connector sinks records to a temporary staging location on object storage, writing files in the configured format and partition layout.
Connector calls the Iceberg REST catalog to perform a transaction, providing the manifest of new files and deletes. Polaris verifies the token and authorizes the catalog operation.
REST catalog persists the updated table metadata object, creating a new snapshot id that refers to the new manifest and files.
Connector marks the Kafka offsets committed for the sink task after the commit success, or moves offending records to a dead-letter queue on failure.
These steps are the target of both monitoring and testing. If files are uploaded but the metadata commit fails, you accumulate orphan files. If metadata commits happen but snapshots do not advance, consumers and query engines will not see new data. See Dremio's practical notes on snapshot expiration for consequences and safe retention behavior in long-running streams.
Required reading and API surface
Before you begin, read the Iceberg Kafka Connect documentation, the Iceberg REST Catalog docs, and the Polaris guides for authentication and policies. These are the authoritative references for connector options, REST endpoints, and Polaris token flows. My examples assume the connector version documented by Iceberg's Kafka Connect docs as of the last checked date. Verify your connector distribution and configuration names, because they are version-specific and change between Iceberg releases.
Key pages I used while building these examples: the Iceberg Kafka Connect guide explains sink properties and format handling, the Iceberg REST Catalog documentation shows the metadata endpoints and payloads, and the Polaris guides explain OAuth client setup and policy roles. I link these again in the Sources section for your reference.
Worker plugin setup and distribution install
The Kafka Connect worker needs the Iceberg Kafka Connect plugin and any storage connector libraries required to write to your object store. Install the connector plugin into the Connect worker plugin path, or use your Connect distribution's plugin management feature. Distribution names and plugin coordinates are version-specific. Look up the exact artifact name in the Iceberg Kafka Connect docs for your release before you install.
Example: local worker plugin deployment
<?php
# Example steps, adapt for your environment
# 1. Stop any workers on the node
# 2. Create plugin directory
mkdir -p /opt/kafka-connect/plugins/iceberg-sink
# 3. Extract the official connector distribution into that path
#    Use the release artifact name from the Iceberg docs for your version.
# 4. Ensure the object-store client jars (S3, ADLS, GCS) are available
# 5. Restart the worker
systemctl restart kafka-connect
?>
On containerized platforms, bake the plugin into the worker image and mount any cloud credential secrets at runtime. If you use a Connect cluster, ensure all workers have the same plugin layout to avoid classloader mismatches. If tasks move between workers, a missing plugin on the target worker causes task failure and connector-wide instability.
REST catalog connector configuration
Use the Iceberg REST Catalog so the connector performs metadata commits through HTTP. The connector needs the catalog URL, a catalog name, and OAuth credential headers for Polaris. The exact property names in the connector configuration reflect Iceberg's Kafka Connect docs. Verify property names for your connector version.
Topic and table routing. Each technical risk needs a matching test, boundary, or operating signal.
Worked example: connector properties (illustrative)
<?php
# Create a connector config JSON for the REST catalog sink
# Replace values with those for your environment. Validate property names with the
# Iceberg Kafka Connect documentation before applying.
{
  "name": "iceberg-rest-sink",
  "config": {
    "connector.class": "org.apache.iceberg.kafka.sink.IcebergSinkConnector",
    "tasks.max": "6",
    "topics": "orders,payments",

    "iceberg.catalog.rest.url": "https://polaris.example.com/api/iceberg",
    "iceberg.catalog.name": "polaris",

    "iceberg.catalog.auth.type": "oauth",
    "iceberg.catalog.auth.token.endpoint": "https://polaris.example.com/oauth/token",
    "iceberg.catalog.auth.client.id": "connector-client",
    "iceberg.catalog.auth.client.secret": "REDACTED",

    "iceberg.format": "parquet",
    "iceberg.partition.spec": "dt=days(order_ts)",

    "iceberg.table.name.format": "${topic}",

    "errors.tolerance": "all",
    "errors.deadletterqueue.topic.name": "dlq.iceberg",

    "key.converter": "org.apache.kafka.connect.json.JsonConverter",
    "value.converter": "io.confluent.connect.avro.AvroConverter"
  }
}
?>
Important notes on the example above: property names like icebergs.catalog.rest.url are illustrative. Confirm the exact connector keys in your Iceberg Kafka Connect documentation. The connector's OAuth integration uses an HTTP token endpoint, which Polaris provides when you register an OAuth client. See the Polaris guides for client registration patterns and token lifetimes.
Dremio's article about the Polaris REST API gives practical examples of how engines talk to the catalog, which helps when you debug a 401 or 403 during commit. That page explains token exchange and common HTTP failure codes from the catalog that you will see in connector logs.
Topic and table routing
Topic-to-table routing is a key decision. You can map a topic directly to a table, map multiple topics into a single table with a partition column identifying the source, or route topics into namespaced tables. The choice affects schema evolution, compaction needs, and query patterns.
Commit interval tradeoff. The loop turns table or catalog signals into controlled operational changes.
Worked example: routing configuration
<?php
# Examples of topic routing options. The connector may provide a template for table names.
# 1) One topic maps to a one table (simple):
"iceberg.table.name.format": "${topic}"

# 2) Multiple topics into one table, add source column in the record:
"iceberg.table.name.format": "shared_events",
# You must ensure your records include a source field and the schema is compatible.

# 3) Namespaced, topic to schema.table mapping:
"iceberg.table.name.format": "my_namespace.${topic}"

# If you need complex routing, implement a SMT (single message transform) to rewrite
# the target table name into a record field that the connector reads.
?>
Routing consequences to weigh:
One-topic-per-table simplifies schema evolution, because changes affect only that table. It scales table count, which impacts metastore performance when you have tens of thousands of topics.
Multi-topic tables reduce table count, but schema drift becomes a source of rejects and dead-letter events. You must coordinate producers to avoid incompatible changes.
Namespacing usually helps governance and Polaris policy alignment. Map Kafka teams to Polaris groups and catalog namespaces for predictable authorization.
When you choose routing, record the mapping and automate table creation with explicit Iceberg DDL or with a managed onboarding process. If you rely on auto-create behavior, document the default partitioning and schema, because auto-created tables often use minimal, nonoptimal defaults.
Commit interval tradeoffs
The connector groups records into files and commits metadata at a configured interval or when tasks reach file-size thresholds. There is a tradeoff: higher commit frequency reduces recovery and replay window, but increases the number of snapshots and small files. Lower commit frequency reduces snapshot churn, but widens the replay boundary on failure.
Failure and replay boundaries. A reversible canary keeps an unsupported client or unsafe policy from becoming a fleet-wide incident.
Quantifying the tradeoff
Concrete numbers help pick defaults. Suppose your producer throughput is 1000 records per second, average record size is 1KB, and you target 128MB compressed files. You will create roughly one file every two minutes per active partition. If you commit every 30 seconds, you will create multiple small files and snapshot ids for the same logical data, increasing manifest and snapshot metadata size. High commit rates require you to run snapshot expiration frequently to limit metadata growth.
On the other hand, if you commit every 10 minutes, a worker crash can require reprocessing up to 10 minutes of data. Exactly-once delivery claims do not eliminate this risk without careful testing, because connector distribution and configuration names are version-specific, and behavior changes between releases. Exactly-once semantics must be validated in failure scenarios that include task restarts, worker churn, and partial commits.
Dremio has practical advice for snapshot expiration and orphan-file cleanup. Use those pages to tune retention and to understand the operational consequences of leaving many snapshots or orphan files behind. Expire snapshots too aggressively and you lose the ability to roll back after a faulty commit. Keep them too long and metadata operations slow down.
Failure modes and replay boundaries
Expect failures across four layers: Kafka, connector task, object storage, and REST catalog authorization. Each layer produces different failure signals and requires different recovery paths. Exactly-once claims need realistic failure testing that covers these layers.
Common failure scenarios
File upload succeeded but metadata commit failed due to a 401 or 403 from Polaris. Result: orphan files. Recovery: run an orphan file cleanup job after you confirm the commit did not succeed. See the Dremio guide on orphan-file cleanup for practices and helper scripts.
Metadata commit succeeded but the connector failed to acknowledge offsets because it crashed immediately after. Result: snapshot advanced, but Kafka may replay leading to duplicate data unless your downstream consumers deduplicate. Recovery: use idempotent keys or upsert patterns where possible.
High commit frequency causes many small files and large snapshot counts, increasing reader latency and compaction needs. Recovery: bump commit size or run compaction jobs to rewrite small files into larger ones. Monitor snapshot counts to decide compaction cadence.
Polaris token expiry during a long commit transaction produces 401 mid-commit. Recovery: ensure token lifetimes and refresh flow are compatible with task lifetime. Log and monitor token refresh failures.
Exactly-once semantics require testing of partial success paths. If you see duplicated records in query results, trace whether the metadata snapshot contains duplicate file references or whether Kafka offsets were reprocessed. The connector may commit offsets only after metadata commit, but network partitions and process crashes create edge cases. Run a set of injection tests that kill tasks at the following points: after file upload before commit, during commit, and after commit before offset ack. That gives you confidence in your recovery actions.
Dead-letter handling and schema evolution
Connectors often receive malformed records or records with incompatible schemas. Configure a dead-letter queue topic so bad records do not block the entire connector. Also, coordinate schema evolution between producers and the sink mapping. Iceberg tracks schema changes in table metadata, but automatic evolution can still produce incompatible types for readers or downstream joins.
Practical evolution rules
Prefer additive schema changes, such as adding nullable fields, which Iceberg handles without rewriting data.
For type changes, perform a controlled migration: create a new column, backfill with a compaction job, and then remove the old column once queries have switched.
Enable strict converters in Kafka Connect to reject unexpected types, and route those records to the dead-letter queue for manual review.
When you rely on automated schema evolution by the connector, capture change events and require a review process for table migrations. This avoids surprise snapshot changes and conflicting commits from multiple producers.
Health checks and monitoring
Connector health is necessary but not sufficient. The worker process can be running, tasks assigned, and still not be advancing table snapshots. Build checks at both the connector and catalog level.
Worked example: health checks
<?php
# 1) Connector task liveness: use Kafka Connect's REST API
GET /connectors/iceberg-rest-sink/status

# 2) Catalog snapshot progression: call the Iceberg REST catalog to fetch the latest snapshot
# Use Polaris-authenticated request; verify snapshot id changes over time.
GET /api/iceberg/tables/my_namespace.orders/snapshot

# 3) Orphan file detection: compare files in the table's data location with manifests referenced
# by the latest snapshot. If files exist that are not referenced, flag them for cleanup.

# 4) Dead-letter queue size: poll the DLQ topic for lag and message count.
# 5) Commit failure rate: monitor connector logs for HTTP 4xx/5xx during commit calls.
?>
Catalog-level checks require the Iceberg REST endpoints. Dremio's post on the Polaris REST API explains how engines interact with the catalog and shows example error patterns to watch. Pull the latest snapshot id periodically and assert it advances for active topics. If it stalls for longer than a configured threshold, alert and run diagnostic probes to classify the root cause.
Practical implementation and evaluation sequence
Below is a suggested sequence to deploy and evaluate the connector in a safe, incremental way. Do these steps in staging until you are confident.
Set up a Polaris test client and register an OAuth client. Verify token issuance and refresh using a short TTL to validate refresh paths. See Polaris guides for client registration details.
Deploy the Iceberg Kafka Connect plugin to a small Connect cluster with two workers. Ensure both workers have the same plugin layout and object-store credentials.
Create a small test topic with synthetic data at your expected schema. Start with a low throughput, like 10 records per second, so you can observe file sizes and commit timing.
Configure the connector with a conservative commit interval and file size target. Enable a dead-letter queue for errors. Use the REST catalog configuration and point it to your Polaris-backed REST endpoint.
Run fault-injection tests. Kill a task after file upload but before commit. Kill a worker during commit. Expire the Polaris token mid-commit. For each test, observe whether snapshots advanced, whether orphan files appear, and whether Kafka offsets were acknowledged.
Measure end-to-end latency, snapshot counts, file smallness, DLQ rate, and commit failure rate for at least 48 hours. Adjust commit frequency and file-size targets based on these numbers.
Run a compaction job if commit frequency caused many small files, then observe query latencies. Use the compaction and orphan-file cleanup guidance in the Dremio posts linked earlier.
Scale throughput gradually, monitoring snapshot growth and metadata operation latency as you increase the number of topics and tasks.
During evaluation, capture logs for the connector, worker, Polaris token exchanges, and REST catalog responses. These traces are indispensable when diagnosing partial failures.
Rollout checklist
Confirm plugin coordinates and property names against the Iceberg Kafka Connect documentation for your connector version. Connector distribution and configuration names are version-specific.
Provision Polaris OAuth client credentials and validate refresh behavior in production-equivalent token lifetimes.
Secure object store credentials, and ensure IAM policies allow object listing, put, delete, and multipart actions the connector needs.
Decide and document topic-to-table routing. Automate table creation or document the expected auto-create defaults.
Set commit interval and file size targets based on producer throughput calculations and the snapshot tradeoffs described above.
Enable a dead-letter queue and monitor it. Implement an operational runbook to inspect and reprocess DLQ items safely.
Implement catalog-aware health checks: snapshot progression, orphan-file checks, and commit error monitoring.
Plan snapshot expiration and orphan-file cleanup cadence. Tune the retention window to balance rollback needs and metadata growth. See Dremio's snapshot expiration guidance for specifics.
What to measure after deployment
Snapshot advance rate, per table. Alert if a table sees no new snapshot for a configured threshold.
Commit error rate, split by HTTP 4xx, HTTP 5xx, and storage client errors. A rising 401 indicates auth problems.
DLQ throughput and backlog. An increase usually signals schema drift or converter issues.
Average and median file sizes written per table partition. Small median file sizes indicate compaction is needed.
Metadata operation latency, including list and commit times against the REST catalog. Track linear or exponential growth as snapshot counts increase.
End-to-end latency: time from Kafka produce to record being visible to query engines, measured by writing unique ids and polling the table through the REST catalog or a query engine.
Measure these metrics continuously and include them in your alerting strategy. For example, alert when the average file size drops below a configured threshold or when snapshot metadata size grows faster than expected. Measure at both the topic and table level to spot hotspots.
Failure-mode response patterns
When you see failures, follow a predictable triage path:
Classify the error as storage, catalog, auth, or connector. Use logs and HTTP status codes from the connector commit attempts.
If commits failed with 4xx, check Polaris token and policies. Use Polaris guides to validate client permissions and scopes. A 401 or 403 indicates an auth or policy problem.
If file uploads are incomplete or multipart failed, inspect storage client logs and cloud provider quotas.
If the catalog shows snapshots advanced but you see duplicates, reconcile by tracing offsets and snapshot timestamps. You may need a deduplication job or to switch to upsert semantics if your schema supports it.
For orphan files, run a safe cleanup that cross-references manifests referenced by the latest snapshot. Do not delete files referenced by any retained snapshot until you are confident you no longer need rollback capability.
Document all recovery steps in runbooks and run a full recovery drill quarterly. Include token rotation, compaction, orphan-file cleanup, and reprocessing from DLQ items in the drill.
Limits and things to verify
Do not assume universal behavior across Iceberg releases. Connector property names, plugin distributions, and exact REST payloads are version-specific. Verify the behavior of exactly-once claims by simulating the failure modes described above. High commit frequency creates snapshot and small-file pressure, which increases metadata costs and can hurt read performance. If you need sub-second visibility, verify that Polaris token refresh and commit latency meet your SLA under load.
Practical worker plugin deployment checklist and validation steps
Place the worker plugin artifacts where the Kafka Connect runtime will load them, validate the plugin class names, and confirm the connector can start a single task before scaling. Do these steps in a nonproduction environment first and automate every step you repeat in production. The sequence below assumes you have the connector distribution and the worker plugin zip or jar from your vendor. Specific file names and connector distribution names are version specific, so verify them against the connector release notes you are using.
1) Prepare a clean test worker image or VM. Install the Kafka Connect runtime matching your production version, or use the same container image. If you use a Connect cluster managed by Kubernetes, create a test Connect deployment with the same mount points for plugin paths.
2) Install the connector distribution. Expand the distribution into the plugin path that Connect scans. Typical locations are a plugins directory referenced by the worker plugin.path configuration. Do not mix multiple versions of the same connector in a single plugin folder. If your Connect distribution supports it, place each connector in its own subdirectory to avoid classloader conflicts.
3) Verify the plugin is visible. Use the Connect REST API, GET /connector-plugins, to list available plugins. Confirm the connector class name appears exactly as documented by the distribution. If it does not appear, check file permissions and the worker logs for classloader errors.
4) Deploy a single connector instance with the REST catalog configuration you intend to use in production, but with test credentials and a test Polaris or REST catalog endpoint. Start with tasks.max set to 1. Submit the configuration and watch the worker logs. The connector should create its configured internal directories and log a successful metadata registration. Note the exact log lines that indicate success for later automation checks.
5) Validate the connector can write one batch. Produce a small number of test messages to the Kafka topic the connector is watching. Confirm a new Iceberg manifest and data file appear in the target table location, and that the table's metadata reflects the new snapshot. Use the Iceberg REST catalog API or Polaris catalog guide to query the table metadata. Verify the file sizes and snapshot creation timestamps match expectations.
6) Scale tasks and run a soak test. Increase tasks.max to the production value in a staged manner. Monitor for task rebalance churn, classloader warnings, and any increase in small file creation. Let the test run long enough to create snapshots on multiple commit intervals. Pay attention to connector logs that mention conflicts during commit operations; these are expected under contention but should be rare if routing and partitioning are configured correctly.
7) Automate the verification. Capture the specific REST calls and log assertions that indicate a healthy plugin deployment. Include: GET /connector-plugins to check visibility, GET /connectors/{name}/status for connector health, and a scripted check against the Polaris or REST catalog to confirm the incremental snapshot ID increased after producing messages. Store these checks in your CI pipeline so you redeploy with confidence.
Failure indicators to watch for during deployment:
Connector not listed by GET /connector-plugins, or missing class name, which usually means a plugin path misconfiguration or permission issue.
Repeated task restarts within minutes of each other, indicating a runtime exception or an inability to acquire resources.
Manifest write failures in logs, typically permission or network errors toward the object storage or the catalog write endpoint.
High small-file churn during scale tests, which may require rethinking commit interval or batching strategy.
Document the environment variables, plugin paths, and the exact REST calls you used for validation. Those runbooks make future rollbacks safe and traceable.
Failure injection test plan for commit and replay boundaries
Exactly-once semantics require more than theory. You must test real failure modes in a controlled environment. The plan below gives a concrete set of scenarios to run against your Connect + Polaris + Iceberg deployment. Each test includes the expected observation and the decision you must make when the system behaves differently.
Test prerequisites: a test Kafka cluster, a test Connect cluster with the plugin installed, a Polaris instance or REST catalog endpoint, and a test Iceberg table. Instrument all components with timestamps and ids for messages, and capture worker logs. Use topic partitions greater than one when testing rebalances.
1) Mid-commit worker crash. Produce N messages, where N spans multiple batches such that the connector attempts a commit during the test window. Just before the connector issues the commit to the catalog, kill the worker process. Expected outcome, version qualified: after worker restart and task recovery, the connector should either successfully complete the commit again if it can retry idempotently, or write an additional snapshot that contains the same messages without duplication in the table query results. If you observe duplicated visible rows in table queries, inspect the projection and deduplication strategy. Exactly-once guarantees are implementation dependent and require testing against your connector and catalog versions.
2) Network partition between worker and object storage. While the connector writes data files, simulate intermittent S3 failures or increased latency. Expected outcome: some file writes may fail or time out. The connector should surface clear manifest write or file upload errors in logs. When retries resume, you may see incomplete manifests. Verify the connector creates a consistent snapshot only after file uploads and manifest writes complete. If you see orphan data files that are readable from object storage but not referenced by any snapshot, add a routine orphan detection script to your runbook and consider increasing commit intervals.
3) Polaris REST catalog unavailability during commit. Configure the catalog endpoint to reject requests for a short window. Produce messages and allow the connector to reach the commit phase. Expected outcome: the connector retries per its retry policy and either eventually commits or aborts the attempt. Observe whether partial manifests remain. If commits repeatedly fail and tasks back off indefinitely, you need an escalation policy to manually inspect the staging location and decide whether to force a metadata repair or to let the connector re-attempt after the catalog returns.
4) Kafka partition reassign during a commit. Trigger a partition leadership change while the connector is mid-commit. The connector should detect the rebalance, revoke partitions, and either complete its in-flight commit before stopping, or abort cleanly and leave a replay boundary that is clear to operators. If you cannot determine the replay start offset without manual inspection, add diagnostic metadata to the connector commit logs so operators can identify the last fully committed offset per partition.
5) Double write due to connector restart + at-least-once source. Combine a worker restart with a source producer that may resend messages on failure. Expected outcome: if your connector and table design rely on idempotent keys, deduplication should eliminate duplicate visible rows. If deduplication is not configured, you will observe duplicates and must choose one of these fixes: use primary key columns and Iceberg's append-only deduplication techniques, adjust producer semantics, or implement post-load deduplication using table rewrite operations.
For each test record:
Exact sequence of steps to reproduce.
Expected log lines and REST responses you will use to determine success.
Recovery actions you will take if the system fails the test.
Run these tests on connector versions you plan to run in production. Annotate the outcomes in your deployment playbook with the connector and Polaris catalog versions. Facts here were checked on September 22, 2026 where the behavior is catalog- and connector-version specific. Do not assume newer versions behave identically without retesting.
Operational metrics, alerts, and dashboards to build
Build three dashboards: connector health, commit and file metrics, and table snapshot behavior. Instrument both Kafka Connect metrics and Polaris or REST catalog observations. Below are concrete metrics and alert thresholds to start from. Tune thresholds based on your data sizes and commit interval.
Connector health metrics to capture:
Connector status, from GET /connectors/{name}/status. Alert if state equals FAILED or TRACE shows repeated task restarts within five minutes.
Task rebalance count per hour. Alert if you see more than five rebalances per hour for a connector under normal load.
Connector commit latency, measured from first manifest write attempt to successful commit acknowledgement. Alert if median exceeds five times the historical baseline.
Commit and file metrics to capture:
Files created per minute and average file size. If average file size is less than 1 MB for sustained periods, you will face small-file pressure and snapshot growth problems.
Number of manifest files created per commit, and manifests referenced per snapshot. Spikes in these numbers indicate either a misconfigured routing scheme or too-frequent commits.
Upload failure rate to object storage, measured as failed PUT operations per 1000 uploads. Alert when failures exceed 2 per 1000, and trigger an operator review at 10 per 1000.
Table snapshot behavior metrics to capture from the Polaris or REST catalog:
Snapshots created per hour per table. A high snapshot rate correlates with retention and compaction needs. Alert when snapshots/hour exceeds a baseline by a configurable factor, typically 3x.
Snapshot size (bytes of data files referenced). If snapshot size remains tiny, review commit interval and batching settings.
Time to snapshot visibility, the delay from commit initiation to when the snapshot is queryable. Alert when this exceeds your SLA for data freshness, for example 30 seconds for near-real-time use cases.
Suggested alert examples and operational responses:
Alert: Connector task restarts > 5 in 10 minutes. Response: automatically collect logs and increase task logging level, then notify oncall. If restarts continue, scale down tasks.max to 1 and run failure injection tests.
Alert: Upload failure rate > 2/1000. Response: check network and storage endpoint health, validate credentials, and run object storage SDK test uploads from the worker hosts.
Alert: Average file size < 1 MB for 30 minutes. Response: inspect commit interval and message batching, and consider increasing commit interval or changing routing to larger partition granularity.
Alert: Snapshots/hour unexpectedly high. Response: run a metadata inspection, consider snapshot expiration policy and schedule a compaction job to rewrite small files.
Dashboards should include links to the Connect REST status endpoints for quick drill down. For Polaris or REST catalog metrics, build a widget that shows latest snapshot id and its timestamp for each table. If you rely on the Iceberg REST catalog, instrument the REST calls you made in your health checks so alerts can point to specific API responses to check.
Finally, collect business-facing SLAs that map to these metrics. For example, your data freshness SLA might say 95 percent of records must be visible within 60 seconds. Map that SLA to commit visibility time and snapshot time metrics above so you can measure the user impact of technical incidents.
Worked example: automated health check script and what it should assert
Below is a concrete checklist that an automated health check script should perform at regular intervals. The script exercises the worker plugin visibility, connector health, topic routing correctness, and quick end-to-end write visibility into the Iceberg table via the Polaris or REST catalog. The examples assume you have the connector name, the plugin class name, topic, and table identifiers available as variables.
Health check assertions to implement programmatically:
Plugin presence: assert GET /connector-plugins returns the expected class name. If not present, fail fast and mark the worker as unhealthy.
Connector status: assert GET /connectors/{name}/status returns RUNNING for the connector and all tasks. If any task is in FAILED state, gather logs and fail the check.
Routing sanity: for each routing rule, assert the connector configuration contains the expected topic-to-table mapping. If the connector supports a way to expose effective routing per task via the status API, read that. If not, fetch the connector configuration via GET /connectors/{name}/config and parse the routing block, taking care to use the documented property names for your connector version.
End-to-end test write: produce a single test record with a unique id to the target topic. Wait for a short window, typically 30 to 90 seconds depending on commit interval. Then query the Polaris or Iceberg REST catalog for the table snapshot metadata to confirm a snapshot timestamp later than the test record produce time, and verify the manifest references a data file containing the test id.
Orphan detection quick check: compare files under the table data prefix in object storage against files referenced by the latest snapshot. If any recent files are present in object storage but not referenced and were created in the last X minutes, raise an alert. X should be 2x your commit interval plus a margin for retries.
Implementation notes, do not invent keys: use the Connect REST API documented by your Kafka Connect version for plugin and connector checks. Use the Polaris guides or the Iceberg REST catalog documentation to read snapshots and manifests. The exact REST endpoints and JSON fields you should parse depend on the API versions; verify them before automating.
Failure modes the health check should differentiate:
Connector visible but tasks failing individually, which indicates task-specific runtime issues such as deserialization errors.
Connector running but no recent snapshots, which suggests the commit interval is too long or routing prevents writes to the table.
End-to-end writes visible in object storage but not in snapshots, indicating upload success but catalog commit failure.
Files referenced by snapshots that are missing from object storage, a rare but critical issue that requires immediate investigation of storage integrity.
What the script should return to your monitoring system:
A boolean healthy flag for each connector and worker host.
Last successful end-to-end timestamp and the test record id, for auditability.
Counts of orphan files discovered in the recent window.
Diagnostic bundle link if any check fails, containing logs, connector config, and the last few REST responses from the catalog.
Automate this script as a health probe in Kubernetes or a cron job in VM environments. Keep the probe from running too frequently; it should not itself create load that affects commit behavior. A good starting cadence is once per minute for basic checks and once every five minutes for end-to-end write validation.
FAQ
What catalog properties must I confirm before installing the connector?
Confirm the REST catalog endpoint URL, the exact connector property keys for catalog configuration in your connector version, and the expected auth mechanism. Check the Iceberg REST Catalog docs for REST endpoints and the Iceberg Kafka Connect docs for connector property names. I checked these sources on September 22, 2026 for correctness where freshness matters.
Can I rely on exactly-once delivery out of the box?
Do not rely on exactly-once claims without testing. Exactly-once semantics need validation across task crashes, partial commits, and token refresh failures. Test killpoints such as after file upload before commit, during commit, and after commit before offset ack to confirm behavior.
How often should I commit?
There is no single right answer. Choose a commit interval and file-size target that trade off replay window and snapshot pressure. Start with defaults that produce 100MB to 200MB files at your expected throughput, then adjust. Monitor snapshot counts and file sizes and tune accordingly.
How do I detect orphan files?
Compare the object-store listing for the table's data location with the manifests referenced by the current and retained snapshots fetched from the REST catalog. Files not referenced by any retained snapshot are orphans. Use an automated job to report them before deletion. Dremio's orphan-file cleanup guidance provides practical scripts and safety checks.
Where does Polaris fit in the flow?
Polaris provides the catalog endpoint and enforces OAuth-based authorization for metadata commits. The connector requests tokens from Polaris and includes them in REST calls to the Iceberg catalog. For debugging 401s and 403s, Dremio's Polaris REST API post has helpful examples of token exchange and typical failure modes.
How do I handle schema changes across topics routed into a single table?
Coordinate producer schema changes, prefer additive changes, and use explicit schema migration steps for type changes. If you must accept different schemas, include a source column and use a normalization pipeline to produce a single coherent schema before writing into Iceberg.
Related Dremio guides
These guides cover adjacent implementation details that are outside this article's main scope.
Intro to Dremio, Nessie, and Apache Iceberg on Your Laptop
Editor’s note, September 2026. This post was published in September 2023 and some product details have changed since. Nessie is still available and self-deployable under the Apache-2.0 licence, and it remains the clearest implementation of catalog-level branching. It is not an Apache Software Foundation project, and its development has slowed considerably. For how the current […]
Aug 16, 2023·Dremio Blog: News Highlights
5 Use Cases for the Dremio Lakehouse
With its capabilities in on-prem to cloud migration, data warehouse offload, data virtualization, upgrading data lakes and lakehouses, and building customer-facing analytics applications, Dremio provides the tools and functionalities to streamline operations and unlock the full potential of data assets.
Sep 30, 2026·Dremio Blog: Open Data Insights
Apache Iceberg 1.12.0: What’s New, Breaking Changes, and Upgrade Guide
Apache Iceberg 1.12.0 expands v3 engine support, REST catalog operations, streaming reliability, and v4 groundwork. Learn how to upgrade safely.