Technical review: Last verified September 29, 2026 by Alex Merced. This guide was checked against current Apache project documentation. Apache Polaris 1.8.0 is the latest documented release; examples that name an earlier release retain that version scope. Validate configuration in a non-production environment before rollout. For the broader context, see what Apache Polaris is and how it governs Iceberg tables.
Polaris event listeners turn catalog and security activity into records that an external logging system can retain and analyze. A production design captures who acted, what resource changed, the result, request identifiers, and timing, while excluding credentials and limiting sensitive metadata. Audit value comes from durable export, normalized identity, retention, and tested alerts, not from enabling a listener alone.
Why event listeners and audit logging matter in production
If you run Apache Polaris in production you need event listeners for operational visibility and a separate audited archive for compliance and forensics. Polaris emits events for catalog changes, authentication and authorization decisions, and other runtime activity. But an event stream is not automatically an immutable audit archive. You must design for durable export, identity normalization, retention, and redaction to avoid leaking credentials or sensitive catalog metadata. This article explains how to configure listeners, what to include in records, how to write alert rules, and the rollout checklist for a real cluster.
What Polaris emits and where to start
Polaris documents event and configuration behavior per release. Verify the configuration keys and documented listener types for your release. For example, the Polaris 1.7.0 configuration reference lists supported listener modules and settings. See Polaris release documentation for your exact version, and the in development production guidance for upcoming changes. These sources are essential when you map code-level hooks to operational configuration because event configuration is release-specific.
Two practical pages I use when implementing are the Polaris architecture explainer and Dremio platform pages describing catalog and access control. The architecture explainer helps you place listeners in the request path and decide whether to capture events synchronously or asynchronously. The Dremio open catalog page explains how Polaris resources map to catalog objects you may want to include or exclude from audits. I link these pages where they explain operational choices later.
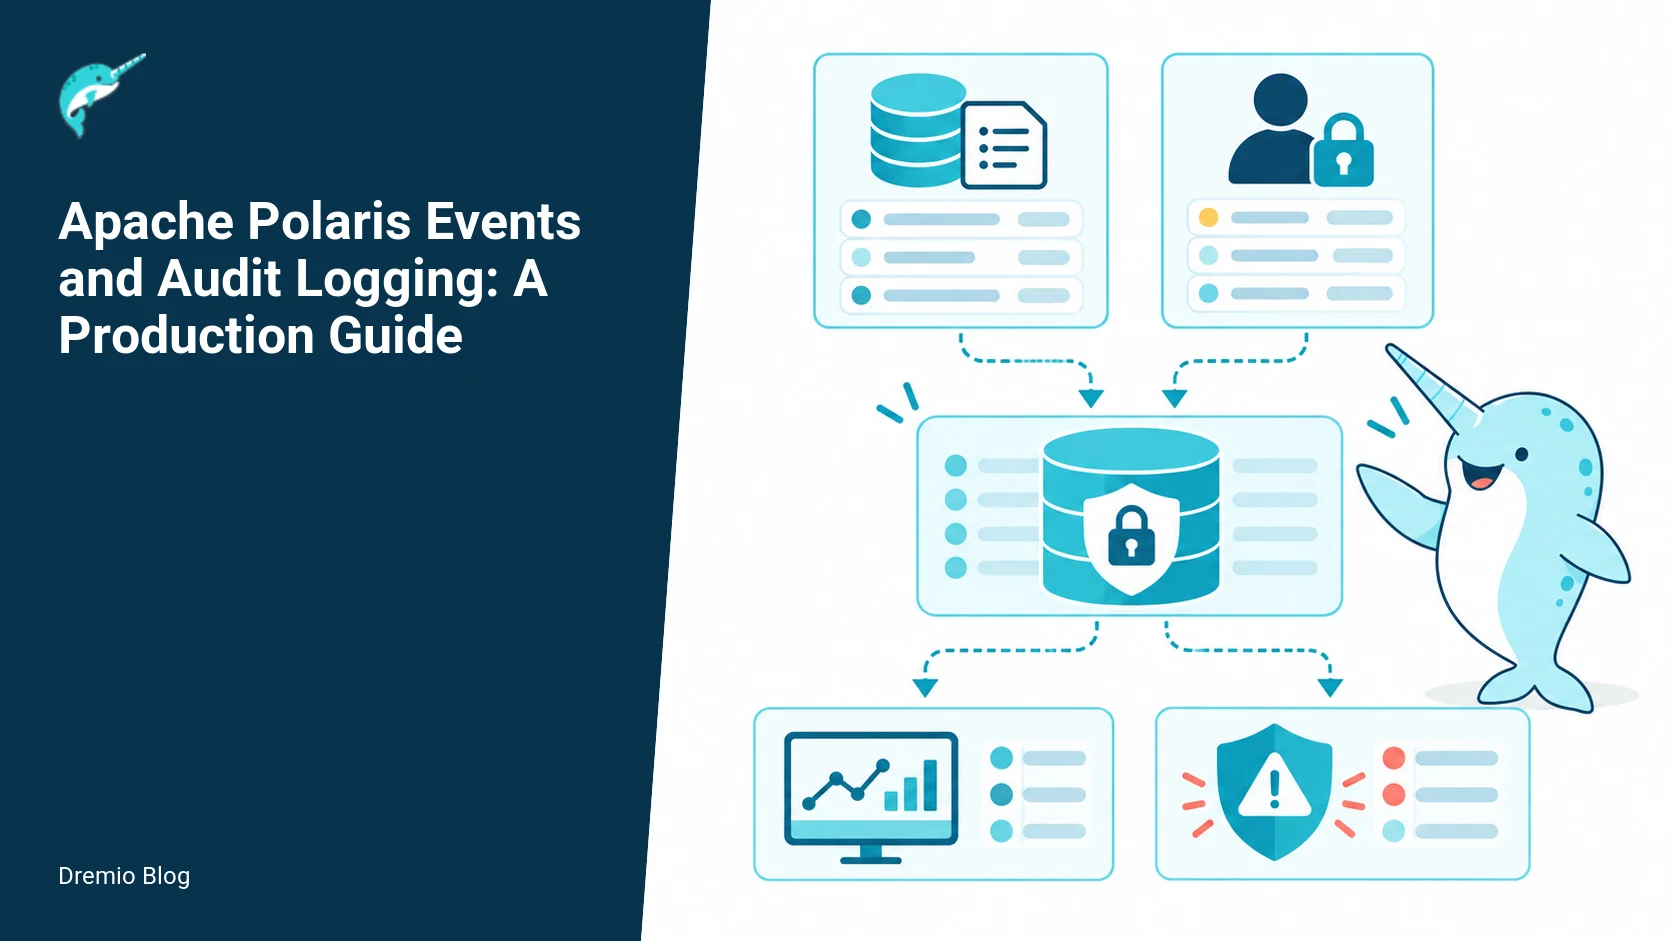
Event creation and export path. Each stage has a result that can be checked before the next stage begins.
Event creation and export path
Events originate inside Polaris at well defined lifecycle points: authentication, authorization, catalog CRUD, and background tasks. When Polaris creates an event the listener framework hands a structured payload to a listener implementation. Listener implementations typically perform one of three actions: synchronous enrichment, fire-and-forget asynchronous dispatch, or local write to a log file. For production auditing, do not rely on a single ephemeral listener output. Build a durable export pipeline.
Typical export pipeline, end to end:
Polaris emits event, configured listener serializes to JSON.
Listener pushes to a queue or stream, for example Kafka or a cloud event hub.
A consumer service validates and enriches records, applies redaction, and writes to an append-only object store or WORM-enabled bucket.
Nearline copies go to SIEM or analytics systems for alerts and dashboards.
Design choices matter. Synchronous delivery during a user request increases latency and can cause user-visible failures when the downstream system is slow. Asynchronous dispatch reduces request latency but increases the risk of temporary loss unless the listener persists to a local durable queue. Neither approach eliminates the need for immutability at the storage layer. For long-term audit you need write-once storage and verifiable integrity checks.
Keep these cautions in mind: Event configuration is release-specific. Logs can contain sensitive catalog metadata. An event stream is not automatically an immutable audit archive. I repeat those because teams often assume listeners solve auditing without adding durable export and redaction.
Audit record anatomy. Each technical risk needs a matching test, boundary, or operating signal.
Audit record anatomy , what to include and what to redact
A practical audit record has three classes of fields: identity and request context, resource and action details, and outcome and timing. Aim for compact, typed fields so downstream parsers and alert rules can rely on field names and semantic types.
Identity and context: normalized principal, identity provider assertion id, client IP, request id, session id, and credential type (masked). Normalize identity to the canonical principal used in your RBAC system.
Resource and action: resource type (catalog, dataset, table, namespace), object identifier, path, API or UI action, and API parameters (redacted).
Outcome and timing: success/failure, HTTP or RPC status code, error message (truncate and redact stack traces), and timestamps: event created, request start, request end.
Include a schema version and event id (UUID) to support future changes and event deduplication. Add source cluster identifier if you operate multiple clusters, for example polaris-prod-us-east. When you export into a SIEM or analytics store, keep the raw JSON alongside an extracted column view to make correlation efficient.
Sensitive fields to redact or exclude: full SQL text when it contains literal values, cloud credentials, external data source connection strings, and any unencrypted secrets. Catalog metadata like table comments, S3 paths, or query plan fragments may include Personally Identifiable Information. Treat catalog metadata as sensitive unless you have explicit classification that it is safe to log.
On the practical side, here is a worked example of a structured audit record. Place this record format into your enrichment service. The code block is JSON with escaped characters for HTML context.
Label any removed fields in the stored object with a redaction marker, for example "sql_text": "REDACTED" and record the redaction policy version. That allows reviewers to distinguish missing data from absent instrumentation.
Security alert correlation. The loop turns table or catalog signals into controlled operational changes.
Listener configuration, a worked example
Listener configuration is release-specific; verify keys against your Polaris release documentation. The worked example below follows the Polaris 1.7.0 patterns for listener registration and shows an asynchronous Kafka-backed listener pattern. Do not copy keys verbatim without checking the configuration reference for your version.
High level steps:
Register the listener module in the Polaris configuration.
Configure the listener to serialize events to compact JSON and push to a durable topic.
Enable local buffering or an on-disk queue for brief outages.
Set a retry policy with exponential backoff and a capped dead-letter topic.
Example configuration fragment, adapted to the documented 1.7.0 options. Verify exact key names in the official reference.
Operational notes: use a dedicated topic with retention that matches your ingest pipeline, do not send raw SQL to the topic unless you have redaction upstream, and partition by request id or cluster id for consumer parallelism. Configure producer client timeouts shorter than your Polaris request timeout to avoid cascading stalls.
On the consumer side, run a worker set that validates schema, applies redaction policies, and writes to an append-only store. The worker should sign the record with a service key to provide an auditable ingestion chain of custody.
Alerting rules and examples
Alerts are where audit logs become operationally useful. Build rules that detect privilege escalation, credential sweeps, mass metadata exports, and repeated failures from a single principal or IP. Alerts must reference normalized identity fields and correlate with RBAC events. For RBAC knowledge, I often cross-check the events against documented access control behavior.
Example alert rules, expressed as prose so you can implement in your SIEM or alerting engine:
Privilege escalation: trigger when a catalog.update with changed role bindings or owner happens and the initiating principal is not in a predefined admin group, and the change was not performed by the credential vending service account. Use the idp_assertion_id and principal fields to deduplicate.
Credential sweep: trigger when an export or discovery action returns more than N resource URIs in a single request, where URIs include cloud object store paths. N depends on your environment; start with 100 and tune.
Mass query failures: trigger when a single principal generates more than M failed queries in T minutes, indicating a compromised client or automated token abuse. Example threshold M = 50, T = 5 minutes.
Unexpected data access: trigger when a read action on a sensitive dataset occurs and the identity is not in the dataset's allowed group. This requires cross-checking the event resource_id against policy data.
When you implement alerts, include runbook links and automated containment steps where safe. For example, if Credential sweep triggers, an automated containment could block the requesting IP at the perimeter while opening an incident with an analyst. Always make automated actions reversible and well tested in staging.
Retention and access boundary. A reversible canary keeps an unsupported client or unsafe policy from becoming a fleet-wide incident.
Redaction checklist and policies
Redaction is not optional. If you log full connection strings, SQL literals, or cloud credentials you will leak secrets. Use this checklist as a minimum.
Identify fields that may contain secrets, including SQL literals, catalog comments, connection strings, plan fragments, and headers.
Define redaction policies by type. For example, replace SQL literals with placeholders, mask the last N characters of tokens, and remove entire header blocks that contain credentials.
Implement redaction at the enrichment consumer, not inside Polaris, so you can change policies without modifying cluster components.
Store the redaction policy version in every record, so auditors know which policy produced the redaction marker.
Run periodic scans of stored audit objects to ensure no sensitive patterns are present. Use token detection and secret scanners tuned to your cloud providers.
Example redaction marker pattern for JSON records: set fields to {"redacted": true, "policy": "v2"} rather than removing the key. That keeps parsers stable while signaling removed content.
Failure modes and how to handle them
Expect these failure modes in real deployments.
Downstream unavailability: If Kafka or your cloud event router is down, synchronous listeners can cause request timeouts. Mitigation: local durable buffer, backpressure with fail-open policy for nonsecurity-critical events, and alerts for buffer growth.
Silent redaction gaps: If redaction is misconfigured you may store secrets at scale. Mitigation: pre-deployment tests with synthetic secrets, continuous scans, and a policy allowing rapid re-ingestion after redaction fixes.
High cardinality fields: Logging full SQL or table paths can blow up index and storage costs. Mitigation: normalize and sample heavy fields, and aggregate high-cardinality values before indexing.
Immutability assumptions: Assuming the event stream alone is immutable is dangerous. Mitigation: write to an append-only object storage with server-side or provider-managed immutability.
Operationally, instrument metrics for listener queue length, failed deliveries, and the lag between event creation and archival. Those metrics indicate whether your pipeline is healthy or you are losing events.
Rollout checklist
Confirm Polaris version and check the configuration reference for listener keys and supported listener types. I used the Polaris 1.7.0 documentation when drafting examples.
Implement listener in a nonproduction environment and push events to a test topic or staging bucket.
Run synthetic traffic that covers catalog CRUD, authz checks, failed logins, and background tasks. Verify each event maps to the expected schema version and contains the expected redaction markers.
Verify consumer enrichment service applies redaction and writes to write-once storage. Verify integrity hashes and retention policies are applied.
Create test alerts and exercises that trigger containment runbooks without blocking production traffic. Tune thresholds to reduce false positives.
Scale test to expected production throughput and measure latencies, queue depth, and storage growth for a dry run window equal to your planned retention period.
Perform a security review of logged fields to ensure no secrets are captured. Use dedicated secret-scanning tools for binary and text artifacts.
Enable production with a staged rollout and monitor listener metrics carefully for the first 72 hours. Keep a rollback plan that disables the listener module if necessary.
Label any claims about configuration behavior with the date checked. Configuration keys and behavior were checked against Polaris 1.7.0 release notes and reference on September 22, 2026.
What to measure after deployment
After you ship an auditing pipeline measure both correctness and operational health. Key metrics to collect and graph:
Event correctness metrics: percentage of events with valid schema version, percentage of events with redaction policy applied, and count of missing critical fields like request_id or principal.
Delivery metrics: producer success rate, consumer processing latency (time from event timestamp to archive write), and dead-letter rate.
Operational metrics: local buffer size, number of retries, and object store write errors.
Security metrics: number of detected secrets in archived objects via automated scans, and counts of incident triggers from alert rules.
Cost metrics: storage growth rate and index sizes for your analytics store so you can budget retention effectively.
Set SLOs. For example: 99.9 percent of events archived within 5 minutes, and zero unredacted secrets in archived records over a rolling 30 day window. Make SLOs concrete and testable.
Practical evaluation sequence
Do this sequence in staging, and then repeat in production under controlled rollout.
Baseline: capture a one hour baseline of normal traffic without listeners, measure activity you expect to see.
Deploy listener to staging, point to a test topic or bucket, and generate synthetic events covering every event type described in your version documentation.
Run the enrichment worker, apply redaction, and store outputs. Verify schema and redaction markers using automated assertions.
Execute alert exercises by simulating privilege changes, mass exports, and repeated failures. Confirm alerts trigger and runbooks work as intended.
Scale test by increasing simulated concurrent users until pipeline throughput meets expected production peak plus margin.
Review results with security and compliance teams, and update redaction rules if any sensitive patterns are discovered.
Rollout gradually to production nodes, monitoring buffer growth and delivery success metrics closely for each batch of nodes added.
Cross-links and why they matter
Use the Polaris architecture explainer to understand where listeners hook into the request flow. That helps you decide synchronous versus asynchronous handling. The Dremio documentation on access control clarifies RBAC semantics that you must mirror in alert rules when you correlate events to policy decisions. The Dremio platform open catalog page explains how Polaris concepts map to the catalog objects you will log and protect. Finally, reference your cluster identifier, for example polaris-prod-us-east, in records so analysts can locate the physical cluster and logs quickly when an incident starts.
Each of these pages provides operational context rather than configuration snippets. Use them as cross-references when implementing audits and alerts.
Concrete listener deployment: step-by-step with configuration snippets
This section gives an actionable rollout for a listener that receives Polaris events, enriches them with catalog context, redacts sensitive fields, and writes structured audit records to an object store and to a SIEM. The configuration shown is tied to Polaris 1.7.0 concepts and paths, and you must verify listener keys and exact property names against your Polaris deployment configuration before applying them in production. I assume you already have a working Polaris cluster and a Kafka or HTTP sink wired to receive events.
High level steps, then the code and configuration you will actually run:
Install the listener service on separate hosts or containers, not on control plane nodes.
Configure inbound transport to match your Polaris event export, for example Kafka topic name, partitions, and consumer group.
Implement enrichment: query your metadata catalog service or cached copy to translate catalog IDs to safe names, without leaking PII.
Apply redaction policy deterministically, log both redaction decisions and before/after digests for validation when necessary.
Emit final structured records to object storage with partitioning by date and high-cardinality fields hashed, and forward critical events to SIEM via a different pipeline.
Below is a representative listener configuration fragment. It is formatted for a Spring Boot style YAML local service. This is an example, not a claim of a supported or canonical property name in Polaris releases. Confirm listener transport keys and authentication steps with your Polaris 1.7.0 or later documentation.
# listener.yml - example listener service
polaris:
  events:
    transport: kafka  # match export type set in Polaris configuration
    kafka:
      topic: polaris-events-v1
      bootstrapServers: kafka.example.local:9092
      groupId: polaris-listener-group
      maxPollRecords: 500
    http:
      # If Polaris is configured to POST events, configure your HTTP receiver here
      bindPort: 8080

listener:
  workers: 8
  enrichment:
    catalogCacheTtlSeconds: 300
    metadataServiceUrl: https://catalog.example.local/api
  redaction:
    policyFile: /etc/polaris/redaction-policy.yaml
  outputs:
    s3:
      bucket: audit-raw
      prefix: polaris/year={{YYYY}}/month={{MM}}/day={{DD}}/
    siem:
      endpoint: https://siem.example.local/ingest
      apiKeyEnv: SIEM_API_KEY
Operational notes on the snippet above:
Transport must match how Polaris exports events. Polaris configuration is release-specific, see the Polaris 1.7.0 configuration reference for event export keys and examples. Verify topic names and permissions on the messaging system before you enable consumers.
Use a catalog cache to avoid turning enrichment into a latency spike. The cache TTL is a tradeoff between freshness and load on catalog services.
Run multiple worker threads in the listener to parallelize enrichment and redaction, but set a cap so you do not overwhelm the catalog API or backend storage.
Keep SIEM and raw archival outputs separate, you will have different retention and access control requirements.
Structured audit record example, with redaction steps and schema notes
Below is a compact, concrete structured audit record produced after enrichment and redaction. The example follows a JSON style that works well for object storage and SIEM ingestion. Field choices are practical; pick a stable schema in your organization and version it. This example assumes the listener has already translated internal catalog IDs to safe names and applied hashing for high-cardinality identifiers.
Notes and decision points embedded in this record:
Store digests of redacted content. The text_digest lets you detect whether two queries are the same without keeping raw SQL. Use a stable hashing algorithm and a key when you must avoid rainbow table risks.
Define a clear redaction mode. The example uses TOKENIZE_LITERAL, which replaces literal values while keeping query structure. Alternative modes include full removal of SQL, regex-based masking, or parameterization.
Keep an audit of applied redaction rules and policy version. This helps in compliance reviews and future reprocessing if policy changes.
Hash IPs and user IDs rather than storing them raw. Note this limits some investigations, for example IP to geolocation, unless you retain a separate, strictly controlled mapping store.
Alerting rules you should run from day one, with Prometheus-style examples
You already have alert rules in the existing draft. Here are actionable, measurable Prometheus expression examples that map to concrete failure modes and what to do when they fire. These assume the listener exports metrics compatible with Prometheus client libraries. Adjust metric names to match your implementation.
High outbound backlog to object storage, which causes event pileup
# Alert: listener_object_storage_backlog_high
# Fires when the number of unprocessed archival records grows above 10000 for 5 minutes
ALERT listener_object_storage_backlog_high
  IF polaris_listener_outbound_backlog_count{destination="s3"} > 10000
  FOR 5m
  LABELS {severity="critical"}
  ANNOTATIONS {
    summary = "Polaris listener outbound backlog to S3 too high",
    description = "Backlog for archival output is {{ $value }} records. Check S3 throttling, network, and IAM permissions."
  }
Enrichment failures at the catalog lookup layer
# Alert: catalog_enrichment_error_rate
# Fires if more than 5 percent of events in a 1 minute window fail enrichment
ALERT catalog_enrichment_error_rate
  IF increase(polaris_listener_enrichment_errors_total[1m]) / increase(polaris_listener_events_consumed_total[1m]) > 0.05
  FOR 2m
  LABELS {severity="warning"}
  ANNOTATIONS {
    summary = "High enrichment error rate",
    description = "{{ $value }} fraction of events failed catalog enrichment. Investigate catalog API latency, auth errors, or schema changes."
  }
Redaction policy mismatches or missing policy files
# Alert: redaction_policy_missing_or_reload_failed
ALERT redaction_policy_missing_or_reload_failed
  IF polaris_listener_redaction_policy_reload_failures_total > 0
  FOR 1m
  LABELS {severity="major"}
  ANNOTATIONS {
    summary = "Redaction policy failed to load",
    description = "Listener failed to load redaction policy. Audit records may include sensitive content until fixed."
  }
How you respond to these alerts matters. For backlog alerts, scale the listener horizontally and inspect the destination for throttling. For enrichment errors, fail closed if your compliance requirement forbids unredacted records reaching storage, or fail open if availability is paramount but flag records for reprocessing. For policy reload failures, resolve quickly. Missing redaction materially increases compliance risk.
Redaction checklist expanded into policies, tests, and operational controls
The draft includes a redaction checklist. Here I expand that into concrete policy files you should maintain, the tests to run before deployment, and runtime controls to detect regressions. Treat redaction policy as configuration with change control and audit trails.
Policy composition and versioning
Maintain a policy file that lists rule ids, description, intent, and examples. Each policy file gets a semantic version annotation. Example: v2 in the structured audit record above.
Include a human readable changelog and a machine readable checksum. The listener should expose the current checksum as a metric and allow safe rollback of policies.
Redaction rules you should have
mask_literals: replace all SQL string and numeric literals with a token, preserving query structure.
hash_identifiers: hash values of user_id, email, and IP using a salted keyed hash when reversible mapping is not allowed.
drop_sensitive_catalog_props: remove fields like storage_credentials, connection_strings, and access_tokens from any catalog enrichment response.
allowlist_schema_names: permit only known schema or catalog names to be included in plain text. Everything else should be hashed or omitted.
Pre-deployment tests
Unit tests for every rule with representative inputs including edge cases: very long strings, nested JSON, unicode, and binary blobs encoded as base64.
Integration test that streams a synthetic event vector through the listener. The vector should include suspicious payloads such as SQL with embedded credentials, JSON with catalog metadata, and events with multiple user identifiers.
Golden-file comparison. Keep expected redacted outputs and compare byte for byte. If your redaction includes non-deterministic salts, provide a test mode with fixed salt for comparison.
Runtime controls and monitoring
Emit a per-rule counter metric: polaris_listener_redaction_rule_applied_total{rule="mask_literals"} so you can detect drift in rule application counts.
Expose a sample of redacted/unredacted digests for human review. Do not include raw PII in these samples. Use digests and short excerpts only, protected behind an access control mechanism.
Policy reload telemetry: polaris_listener_redaction_policy_reload_success_total and polaris_listener_redaction_policy_reload_failures_total.
Operational guardrails
Fail closed versus fail open. Document and implement the default. For highly regulated systems, fail closed and queue events for manual clearance. For availability-first systems, fail open but flag records and accelerate reprocessing.
Separation of duties for policy changes. Require code review and a second approver for policy changes that relax redaction rules.
Periodic audits. Schedule monthly audits where a controlled set of raw events are reprocessed by compliance engineers to validate redaction effectiveness.
Practical test matrix example. Run this matrix before promoting a listener image.
Test vector: 1000 synthetic events with categories: 50 percent query_execution, 20 percent metadata_change, 20 percent authentication_events, 10 percent administrative_actions.
Pass criteria:
No raw SQL or catalog secrets appear in output samples chosen randomly at 0.1 percent sampling rate.
Redaction rule application rate remains within 5 percent of expected taxonomy counts from the previous stable run.
End-to-end latency from event ingest to archival less than 5 seconds p50, 30 seconds p95.
Failure injection tests
Drop catalog connectivity mid-run, observe fail closed behavior or queued events. Verify alerts fire and backlog metrics increase predictably.
Simulate policy reload with a malformed file and verify the listener keeps running with the last known-good policy if that is your documented behavior. Confirm reload failure metrics increment.
Label any claims about Polaris configuration keys or behavior with the Polaris release you used for verification. I checked the Polaris documentation on September 22, 2026 when preparing guidance about event export configuration and the in-development production guidance. If you need precise key names for your version, consult the Polaris 1.7.0 configuration reference or your Polaris operator docs before applying them.
Operational failure injection and verification plan
Run failure injection against the listener path before wide rollout. The goal is a repeatable set of tests that exercise configuration errors, performance degradation, partial redaction, and consumer-side enrichment failures. Each test below lists the stimulus, the expected listener behavior, the verification steps, and the rollback or mitigation action. Version notes, when relevant, reference Apache Polaris 1.7.0 configuration behaviors checked on September 22, 2026.
Run these tests in a staging cluster that mirrors production network topology, authentication, and catalog size. Use the same listener configuration snippets you will deploy. Keep test data that includes long SQL statements, object names with special characters, and entries that would normally trigger redaction.
Config syntax error
Stimulus: Introduce an invalid listener configuration key or malformed JSON into the listener config file, matching the same file the production agent will read. Polaris 1.7.0 will reject unknown keys in some sections and accept others, so verify your specific key against the documented reference.
Expected behavior: Listener should fail to start, or start and log a clear parsing error to standard error. Polaris itself should log configuration validation messages to the server log.
Verify: Check listener stderr, Polaris server log, and your orchestration health probe. Confirm orchestration marks the pod or service unhealthy if the agent failed to start.
Mitigation: Roll back the config change, deploy an image with a validation check in the entrypoint, or add a startup validation job that parses the file using the same library the agent uses.
Network partition to external broker
Stimulus: Simulate network drop to Kafka or S3 endpoint for 5 minutes.
Expected behavior: Listener should either buffer to local disk within configured retention limits or return transient errors depending on your listener implementation. Do not assume message durability is guaranteed by Polaris alone.
Verify: Inspect local spool directory, observe backpressure metrics, and ensure Polaris does not block critical control plane operations. Confirm alerts fire for consumer lag and error rates.
Mitigation: Implement bounded local buffering, circuit breakers, and clear operator documentation telling on-call to expand broker capacity or clear spool safely.
Partial redaction failure
Stimulus: Deploy a consumer whose redaction module returns malformed JSON for a subset of records.
Expected behavior: The consumer should drop or quarantine malformed records, emit a metric counting redaction failures, and not forward unredacted records downstream. Do not use silent failure modes.
Verify: Query quarantine store, confirm counts in redaction_failure_total metric, and sample the quarantined record to determine which parsing rule failed.
Mitigation: Add schema validation tests in CI, and an automated rollback trigger when redaction_failure_total exceeds a threshold.
High throughput spike
Stimulus: Replay a days worth of events in a compressed timespan, producing a 10x ingestion spike relative to steady state.
Expected behavior: Consumers should backpressure, lag metrics should increase, and alerting rules should trigger well before data loss. Verify that the listener respects backpressure and the broker retains messages for the required TTL.
Verify: Monitor consumer_lag_seconds, publish_rate, and listener_error_rate. Confirm retention settings on the broker prevent immediate data loss.
Mitigation: Throttle producers, enlarge broker partition count, or scale out consumers. Document required scaling steps and expected recovery times.
Enrichment service failure
Stimulus: Shut down the enrichment service that adds catalog context to raw event IDs.
Expected behavior: The enrichment consumer should mark those records as pending enrichment, persist them in an intermediate queue, and emit metrics for pending_enrichment_count.
Verify: Confirm that records are not forwarded to long term archive un-enriched, and that alerts for pending_enrichment_count and enrichment_failure_total fire.
Mitigation: Add a degraded mode where records can be archived with a redaction marker and a pointer to the raw record location, rather than losing context permanently.
Decision table for where to perform redaction
The choice of where to redact affects latency, security boundaries, and your ability to reprocess with updated rules. The table below distills the tradeoffs into operational outcomes and recommended controls. These recommendations assume Polaris 1.7.0 emits the events you need; verify fields against the release configuration reference before coding.
Redact in Polaris listeners
When to choose: Your team wants minimal exposure of sensitive catalog metadata on the network, and you can implement redaction in the agent runtime with acceptable CPU cost.
Pros: Sensitive data never leaves the host, lower blast radius for misconfigured downstream systems.
Cons: Harder to update rules without redeploying listeners. Polaris version differences may change available fields, so validate keys per version.
Controls: Deploy configuration feature gates, automated config validation, and a canary namespace to test rule changes.
Redact in enrichment consumer
When to choose: You need richer context for redaction decisions, like catalog metadata joined from a separate service, or you want to iterate on rules quickly.
Pros: Easier to update rules, centralized governance, can keep immutable raw archive before redaction if required.
Cons: Raw sensitive data exists in transit and in the broker. You must secure broker and transport, and enforce short retention or encryption at rest.
Controls: Encrypt topics, apply topic-level ACLs, retain raw archive only if absolutely necessary, and log who requests reprocessing.
Hybrid approach
When to choose: You need immediate protection plus the ability to reprocess. Perform lightweight redaction in the listener for high-risk fields, and full contextual redaction in the enrichment consumer.
Pros: Reduces exposure while preserving the option to re-enrich non-sensitive fields later.
Cons: More complex pipeline and storage requirements. You must track which fields were pre-redacted.
Controls: Add a redaction_version field to the structured audit record and enforce schema checks in CI.
Practical upgrade and rollback sequence for listener configuration
Configuration changes are release-specific. Before upgrading listeners or Polaris itself, run the sequence below. It reduces risk when configuration keys have moved between sections between releases, as happens across Polaris releases. All version-dependent keys should be checked against the Apache Polaris 1.7.0 configuration reference and the in-development docs when you are on a release candidate.
Step 1, preflight validation: Use a CI job that parses the proposed listener YAML and validates every key against a JSON schema derived from your deployed listener code. If you cannot produce a schema, at least lint for the keys you know are validated by Polaris 1.7.0 server side.
Step 2, dry run canary: Deploy the new config to one small canary cluster or namespace. The canary should process realistic traffic while exporting all structured audit records to a quarantine topic and an audit-dedicated S3 bucket with server side encryption.
Step 3, metric-based promotion: Promote when the canary shows error_rate below a small threshold and redaction_failure_total is zero for a rolling 30 minute window. Define your own thresholds, but document them in runbooks.
Step 4, staged rollout: Roll out in waves. After each wave, run the verification checklist: verify redaction sampling matches expected patterns, reconciliate counts between source and archive, and check for increased consumer_lag_seconds.
Step 5, rollback trigger: Predefine rollback triggers such as sustained redaction_failure_total, backlog growth beyond retention, or unknown keys appearing in structured records. The rollback should be automated when a threshold is breached, but require human approval for config modifications that touch redaction rules.
Step 6, post-rollback remediation: If you must rollback, capture example records that failed, put them in a quarantined bucket, and schedule a reprocess window. Update CI to add tests that reproduce the failure so it does not recur.
Include example CLI or orchestration commands in your runbook. For Kubernetes, that means a rollout restart of the listener daemonset with a pre-check job and a post-check job that queries Prometheus for the key metrics listed below.
Key metrics to gate rollouts
redaction_failure_total, rate and count over 5 minutes
listener_error_rate, the number of transient failures the listener reports per minute
consumer_lag_seconds, aggregated and per-partition 95th percentile
pending_enrichment_count, to detect lost context backlogs
quarantine_store_size, bytes and object count
Label these metrics by cluster, namespace, listener_version, and redaction_version. That labeling makes audits possible when you must reprocess or explain a record to an auditor.
This section deepens the examples you already have, with operational notes and exact verification steps. Verify the listener configuration keys against the Apache Polaris 1.7.0 configuration reference before applying them, since configuration paths change between releases.
Listener configuration notes and verification
When you adapt the example listener configuration, check the following: the agent runtime user has read access to the catalog metadata, TLS settings for brokers are present, topic ACLs exist, and local spool paths are writable. Add a readiness probe that validates the agent can connect to the broker and that the redaction engine loads its rules.
Verification steps for each config change:
Unit test the config file parser in CI, asserting known good and known bad samples.
Deploy to canary and exercise three event types: query start, query end, and schema change. Confirm each appears in the quarantine topic if quarantine is enabled.
Sample the listener log for startup lines that list loaded rule counts. If your agent logs a rule checksum, capture it for future audits.
Structured audit record, with redaction annotations
Use a versioned JSON schema for audit records. Include a redaction_version, redaction_applied boolean, and a pointer to raw_location when you keep raw copies. When fields are redacted, replace values with a deterministic token or a hash plus salt, and record the method in redaction_method.
Verification checklist for audit records:
Schema validation passes for every record before archival. Run JSON schema checks as part of the consumer pipeline.
Sampled records show redaction_applied true when they contain catalog identifiers. Compare counts of redaction_applied across event types.
Retain an audit trail for redaction rule changes by storing previous redaction rules alongside the record, or by keeping a redaction_change log that references the rule checksum recorded at ingestion time.
Alert rules you should run from day one
Prometheus-style alerts are useful because they are declarative and tie to runbooks. The alert rules below are conceptual; implement them using your existing Prometheus or Mimir setup and verify label names match your exporters.
Redaction failure rate
When: redaction_failure_total rate over 5 minutes exceeds 1 per minute for a single listener instance.
Action: Page on-call, open a quarantine review, and pause promotion of new configs.
Consumer lag growth
When: consumer_lag_seconds 95th percentile increases by 2x over baseline for 10 minutes.
Action: Scale consumers, increase broker retention temporarily, and notify platform team.
Quarantine spike
When: quarantine_store_size increases by more than 10% in 15 minutes.
Action: Inspect quarantined samples for systemic parser regressions and run a mitigation plan if necessary.
Pending enrichment backlog
When: pending_enrichment_count exceeds an operational threshold you set based on capacity.
Action: Prioritize enrichment service restart and evaluate whether to archive records with a placeholder pointer instead of waiting indefinitely.
Redaction checklist expanded into tests and controls
Operationalize your redaction checklist by mapping each policy item to a test and an automated control. The items below extend the checklist you already have, with specific tests you can put into CI and runtime checks for the listener.
Policy: Never log full SQL for user-facing queries
CI test: Scan example SQLs and assert a redaction_pass function replaces literals before logging.
Runtime control: A log filter that rejects any log line containing SQL-like patterns unless redaction_applied is true.
Policy: Hash table and column identifiers rather than storing them in cleartext
CI test: Validate deterministic hashing with salt rotation; verify rehashing is possible in offline reprocessing scenarios.
Runtime control: Emit a metric when a record contains an unhashed identifier by mistake.
Policy: Maintain an immutable provenance pointer when raw data is discarded
CI test: Ensure that when redaction removes a field, raw_location is populated and points to an encrypted archive object.
Runtime control: Block archival deletion during the retention period and add an access log for raw_location reads.
Policy: Version redaction rules and record that version in the audit schema
CI test: On rule change, run a reprocessing simulation that asserts previous records still validate against the new schema when redaction_version is considered.
Runtime control: Reject listener startup if the rule repository is unreachable or the rule checksum does not match the expected value for that deployment.
These tests give you automated safety rails. When a test fails in CI, require an owner to explain why the new rule is correct and to sign off on a canary deployment plan.
FAQ
1. Which Polaris configuration docs should I trust for listener keys?
Trust the release documentation for the Polaris version you run. I checked Polaris 1.7.0 configuration reference on September 22, 2026 for examples in this article. If you run a different release, consult that release page or the in development configuration guide if you are tracking recent changes.
2. Can I store raw SQL in audit logs?
Do not store raw SQL with literals unless you have a strict redaction policy. SQL often contains PII or secrets. Store parameterized statements or redact literals.
3. Is the Polaris event stream an immutable audit trail?
No. An event stream is transport. For immutability you must write to append-only storage with integrity checks and retention controls. The stream alone is not sufficient for compliance.
4. Where should redaction run, in Polaris or in the enrichment consumer?
Run redaction in the enrichment consumer. That lets you iterate policies without modifying the cluster, and it reduces the risk of accidental data loss in the source system.
5. What metrics should I set SLOs on?
Set SLOs on delivery latency, archival completeness, and zero unredacted secrets. Example: 99.9 percent of events archived within 5 minutes and no unredacted secrets over 30 days.
6. How do I test redaction before production?
Create synthetic events containing representative secrets and catalog metadata. Run them through the consumer pipeline and scan outputs with secret detection tools until no secrets remain. Keep audit trails of tests and policy versions used.
Related Dremio guides
These guides cover adjacent implementation details that are outside this article's main scope.
Intro to Dremio, Nessie, and Apache Iceberg on Your Laptop
Editor’s note, September 2026. This post was published in September 2023 and some product details have changed since. Nessie is still available and self-deployable under the Apache-2.0 licence, and it remains the clearest implementation of catalog-level branching. It is not an Apache Software Foundation project, and its development has slowed considerably. For how the current […]
Aug 16, 2023·Dremio Blog: News Highlights
5 Use Cases for the Dremio Lakehouse
With its capabilities in on-prem to cloud migration, data warehouse offload, data virtualization, upgrading data lakes and lakehouses, and building customer-facing analytics applications, Dremio provides the tools and functionalities to streamline operations and unlock the full potential of data assets.
Sep 30, 2026·Dremio Blog: Open Data Insights
Apache Iceberg 1.12.0: What’s New, Breaking Changes, and Upgrade Guide
Apache Iceberg 1.12.0 expands v3 engine support, REST catalog operations, streaming reliability, and v4 groundwork. Learn how to upgrade safely.