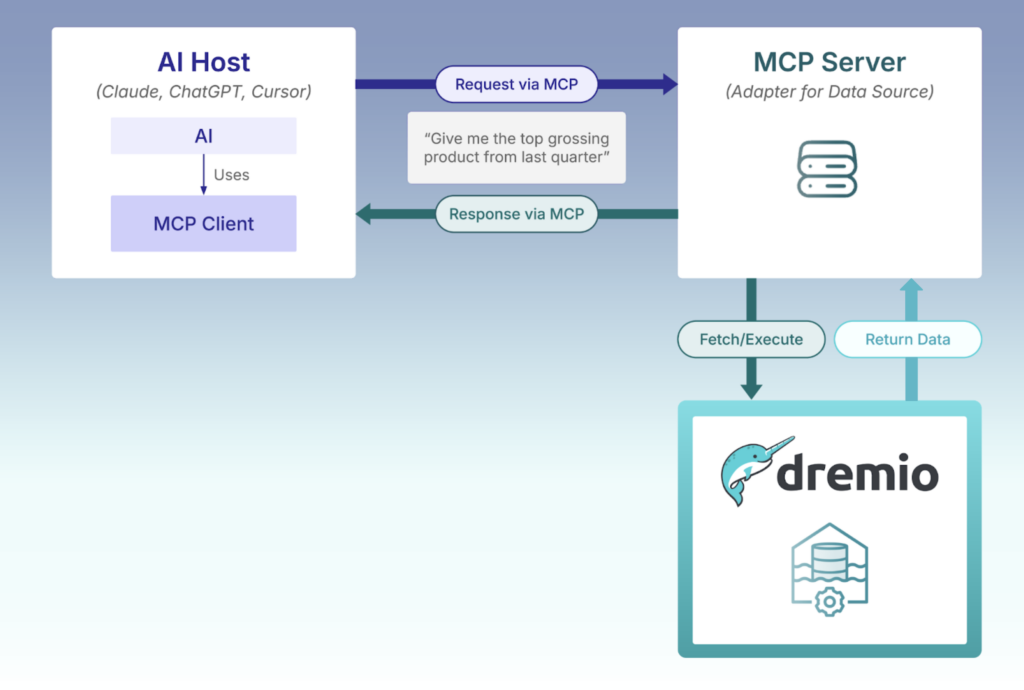
Back in April of this year Dremio debuted its own MCP server, giving the LLM of your choice intelligent access to Dremio’s powerful lakehouse platform. With the Dremio MCP Server the LLM knows how to interact with Dremio; facilitating authentication, executing requests against the Dremio environment, and returning results to the LLM.
Figure 1.1: The high-level interactions of an LLM, the MCP Server, and Dremio.
The intention is for natural language to become the interface to your enterprise data, granting you access to real-time insights, metadata exploration, and context-aware queries. But how well does this new interface perform on existing projects and datasets? For data transformation workflows that were built to prioritise non-technical business users and data consumers?
To put it another way: does the MCP server deliver as a standalone interface or do you need to rethink your data pipelines to get the best performance from AI?
The Test Conditions
The Dremio MCP server has 3 modes, intended for different access behaviours each with their own selection of tools. Our aim is to test the data analytics performance so we shall use the mode FOR_DATA_PATTERNS, which will allow the LLM to look at tables and data in Dremio.
For our AI host I am using Claude desktop for the out-of-the-box frontend and the Sonnet 4 LLM, which is available in all tier plans. I have not set any additional configurations, such as personal preferences nor defined what kind of work I do.
For these tests we want to be interacting with a pre-existing project from the persona of a data analyst. We will use the output from the dbt Fundamentals course on Dremio University, a simple project designed to showcase the various features of the dbt-dremio adapter. The example project called nyc:
refines a sample dataset containing information on taxi trips in New York City,
implements a medallion-style structure (raw, intermediate, marts),
consists of a single data table per layer,
features a semantic layer for the non-raw tables formed of tags and documentation.
If you want to get more familiar with this project, and learn about using dbt with Dremio, bookmark this blog and head over to Dremio University to enrol in the dbt Fundamentals course.
Try Dremio’s Interactive Demo
Explore this interactive demo and see how Dremio's Intelligent Lakehouse enables Agentic AI
The Warm Up
Before we get to asking analytics questions, let's first ask some general questions about the project structure.
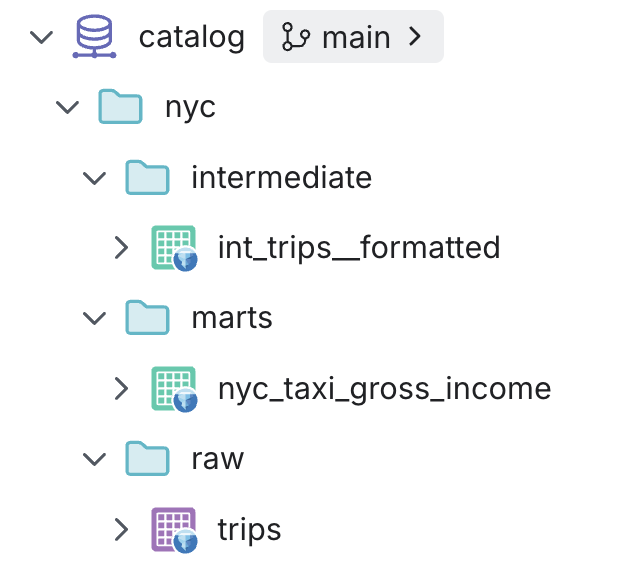
“What is the folder structure in the nyc project?”
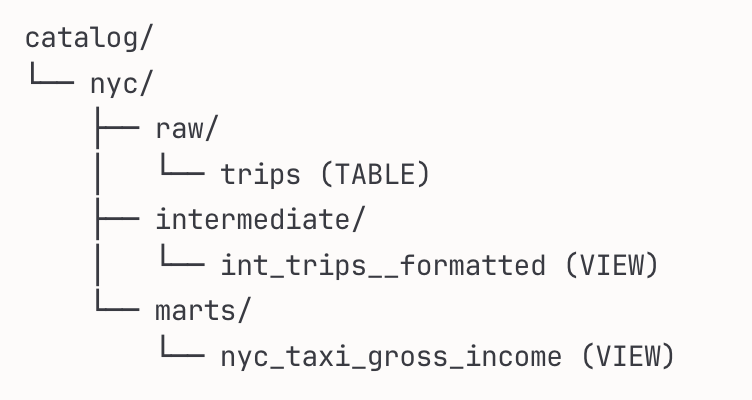
Claude correctly identifies the medallion structure and provides a very handy ascii visualisation of the folder structure, the data tables, and if they are materialised as tables or views.
Figure 2.1: nyc project structure in the Dremio UI.
Figure 2.2: nyc project structure displayed in Claude desktop.
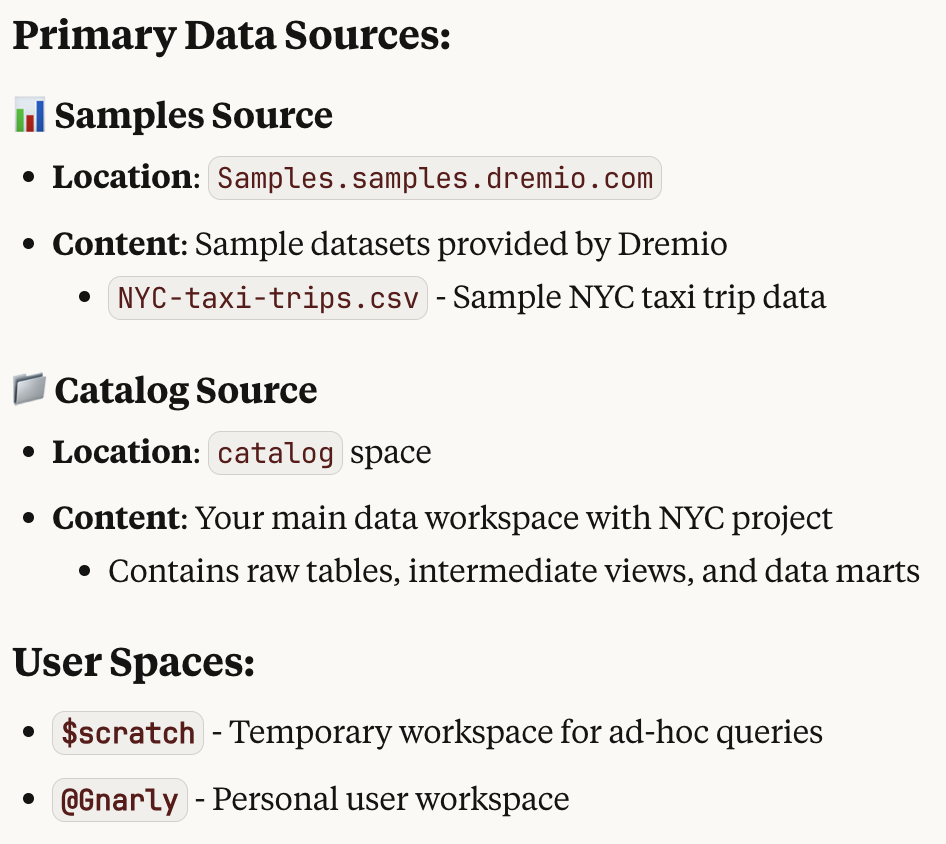
"What sources are available in Dremio for me?"
Claude provides a full list of the sources available to us and describes the content in each (if any) and correctly identifies the catalog as our main workspace. Remember we have provided the LLM with no context, just with the access and tools to look inside Dremio.
Figure 3.1: List of Dremio data sources identified by Claude.
The response also included some extra information relevant to the topic, such as a source type analysis and potentially missing sources. Whilst technically correct this information isn’t what we are looking for and is a result of our basic, imprecise prompts we are providing to the LLM. Let’s see if a more detailed question gets a more concise answer.
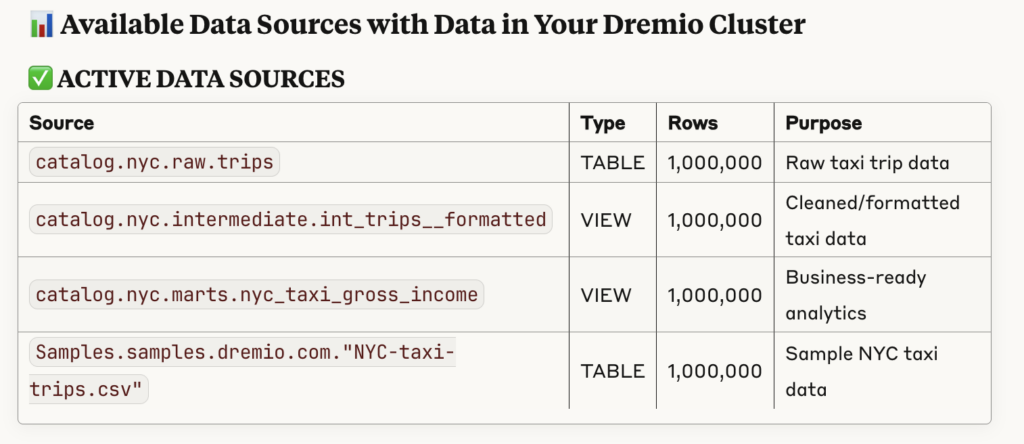
"What data sources in Dremio are available and contain data to use? Do not make suggestions for other sources"
Figure 3.2: Table of Dremio data sources identified by Claude.
That’s more like it! Now we get a succinct response, breaking down each dataset and providing information such as the purpose, format, row count, fields, data types, and tags.
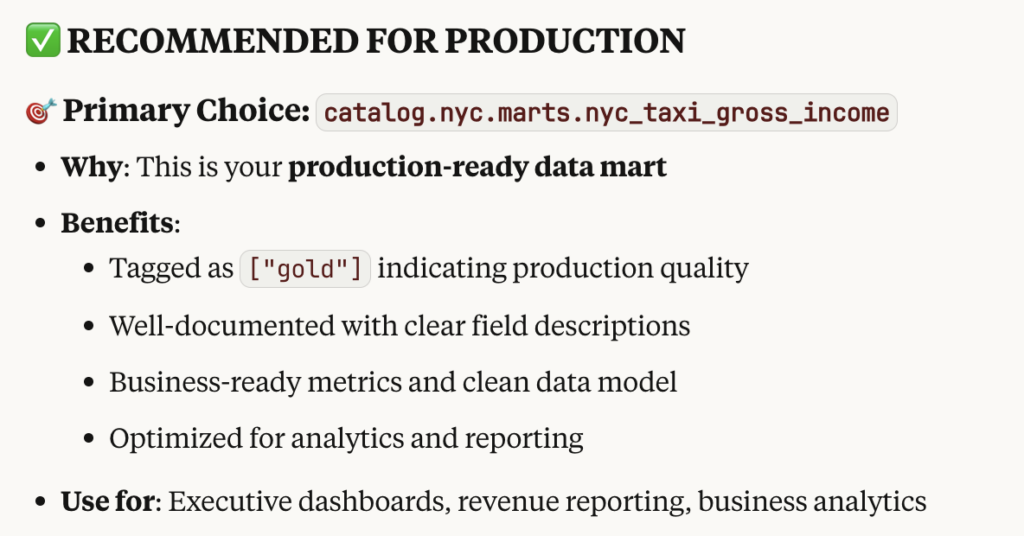
"Which tables should I use in production?"
Claude correctly identifies the marts dataset as fit for production. It has done this by identifying and understanding the context of terms such as mart and gold used in the project structure, data set names, and the semantic layer tags. It has also assessed the dataset schema and understands what attributes are featured in the table.
Figure 4.1: Dataset recommendation for use in production from Claude.
It does the same assessment for all of the four datasets and outlines why certain datasets should not be used. Accurate and informative for the kinds of non-technical users who would use MCP as an interface.
The Real Test
Okay, now with the basics out of the way, how does the LLM perform with analytics questions?
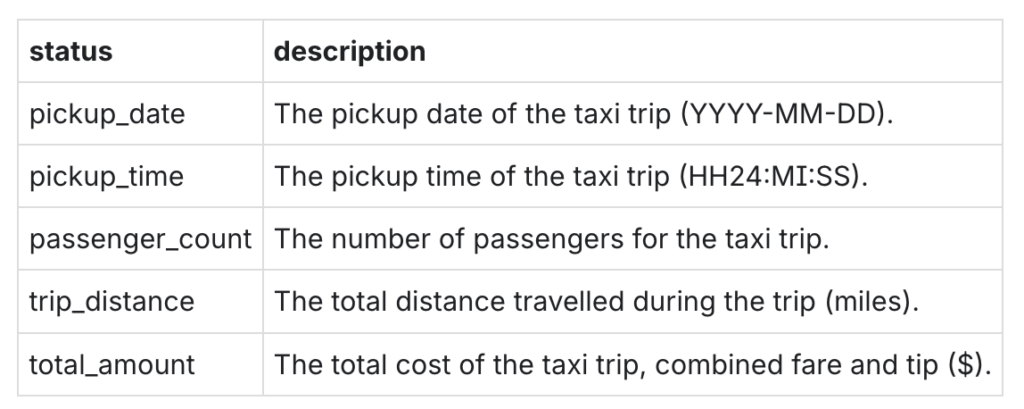
"For the marts table what are the units used for the attributes?"
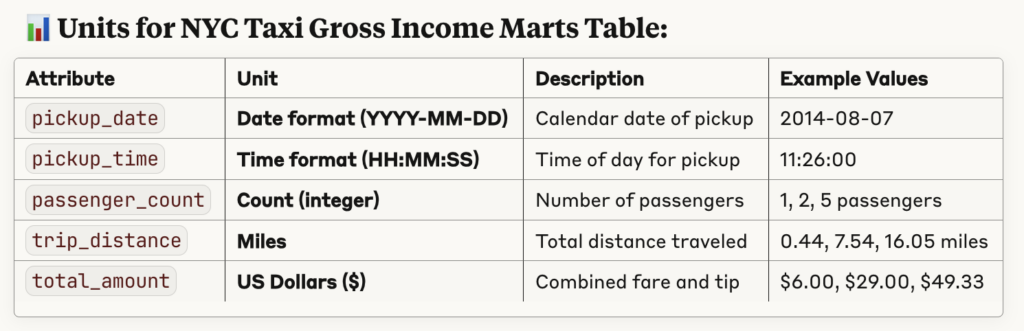
Claude has found our markdown table used as documentation for the marts table and presents it to us. However, it’s not just a copy-and-paste and extra effort was made to parse the description, pulling units out into their own column and providing example values.
Figure 5.1: Schema definition for marts table from the Dremio UI wiki.
Figure 5.2: Schema definition for marts table from Claude.
Along with the table, Claude also puts the units into context, for example confirming that miles is the standard unit for taxi meters in New York city. This demonstrates the key strength of MCP in that it combines the wider understanding and knowledge of an LLM with the specific tools and understanding of our lakehouse.
As a nice little bonus Claude even congratulates us on our great documentation: “Perfect! The marts table has excellent documentation.” Claude, you’re making us blush! 😳
"How many zero dollar trips were made?"
The marts table has one million rows so statistically rare records can be easily missed in a visual UI. The Dremio UI will by default present a sub-sample of 10,000 to 100,000 records and display a warning that it has done this. However, if a user misses this warning and tries to inspect a table visually, e.g. by sorting a column, edge case records can be easily missed.
Claude is inspecting with SQL so it correctly finds 15 taxi trips in the marts table that cost $0. It also provides an assessment of these records, exactly what any decent analyst would do next. Claude takes the initiative and:
examines other attributes, such as passenger_count and trip_distance, to look for patterns,
proposes possible explanations for the data, such as cancelled trips, promotions, or refunds,
concludes that at a percentage of 0.002% these records are not a sign of systemic data quality issues.
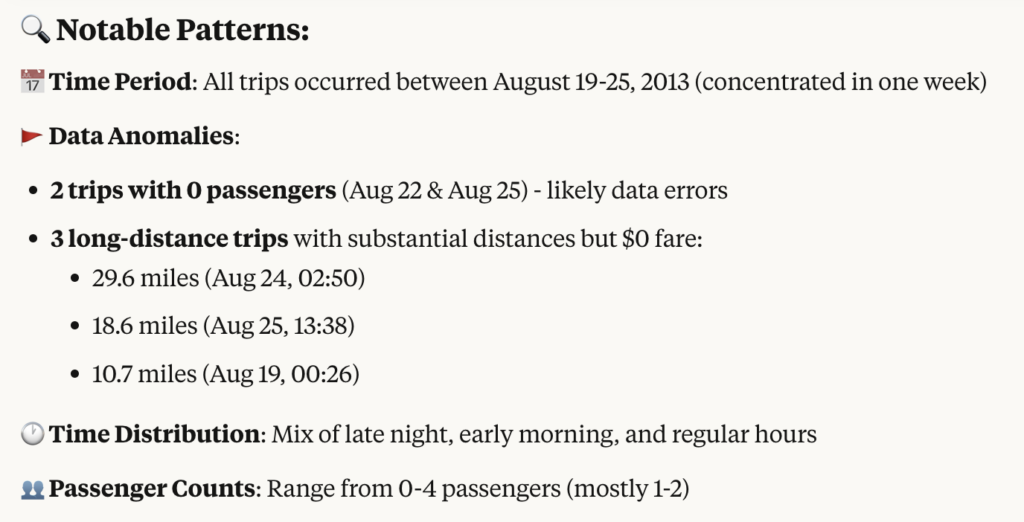
"Show me the $0 trips"
Claude produces a clear table of the 15 records and highlights interesting values in bold. It also provides an assessment of the records and suggests that the long distance $0 trips are worth investigating more. Very useful.
Figure 6.1: Claude's pattern analysis for the taxi trips earning $0.
Wait a minute. It’s saying that there are trips with no passengers, but the dbt project has a data test called assert_has_passengers which sounds like it should catch records like this. Let’s investigate further.
"Show the 0 person trips"
Uh-oh. Claude finds 18 records with 0 passengers and again provides a neat analysis of the records. These can be easily confirmed in the Dremio UI as Claude provides the SQL for the queries it runs. This means that there is potentially an issue with the data test in dbt. In a real world scenario, the analyst can use this information to raise a ticket with the data engineering team or raise it with the owner of the data product.
In our case the data test is functioning as intended according to the description provided in the test’s schema: The taxi cannot carry negative passengers. Return records where passenger_count < 0 to make the test fail.
However, perhaps the data test could be updated to handle these 0 passenger and $0 trips Claude has seen? Which raises the idea of what else could be improved about our little pipeline?
"How could my marts tables be improved?"
Claude goes ham and provides a huge list of improvements. Not too surprising given that we are working with a small, demo data project. These improvement suggestions cover:
Data validation
Edge cases
Additional business metrics
Aggregation metrics
Data quality attributes
Performance optimisations (clustering and partitioning)
Suggested additional tables
It also suggests a priority ranking for these changes and the SQL code to do it! Very cool and very useful, but far too much to cover here in this blog. Perhaps a topic for a future blog?
Conclusion
In our tests we saw Claude provide insightful (and correct!) answers to our natural language questions by applying its comprehensive understanding of SQL, data warehousing concepts, and modern analytics architectures to our Dremio project. We clearly demonstrated that if a data pipeline follows data product best practises the LLM is able to leverage not just your data, but also the schemas and semantic layer to understand and execute against your data.
Claude performed with flying colours, extracting the correct information from Dremio as requested and anticipating follow-up questions with sensible suggestions. And what's even more impressive is that this performance is achieved with a data pipeline never designed for AI integration, without dedicated performance tuning or context enrichment for LLMs.
With direct access to Dremio's system tables and query execution capabilities via the MCP server, LLMs can rapidly explore data schemas, validate data quality, perform complex aggregations, and identify optimisation opportunities. This makes the Dremio MCP server an invaluable partner for data teams working with Dremio's analytics platform.
Try Dremio Cloud free for 30 days
Deploy agentic analytics directly on Apache Iceberg data with no pipelines and no added overhead.
Ingesting Data Into Apache Iceberg Tables with Dremio: A Unified Path to Iceberg
By unifying data from diverse sources, simplifying data operations, and providing powerful tools for data management, Dremio stands out as a comprehensive solution for modern data needs. Whether you are a data engineer, business analyst, or data scientist, harnessing the combined power of Dremio and Apache Iceberg will undoubtedly be a valuable asset in your data management toolkit.
Oct 12, 2023·Product Insights from the Dremio Blog
Table-Driven Access Policies Using Subqueries
This blog helps you learn about table-driven access policies in Dremio Cloud and Dremio Software v24.1+.
Aug 31, 2023·Dremio Blog: News Highlights
Dremio Arctic is Now Your Data Lakehouse Catalog in Dremio Cloud
Dremio Arctic bring new features to Dremio Cloud, including Apache Iceberg table optimization and Data as Code.