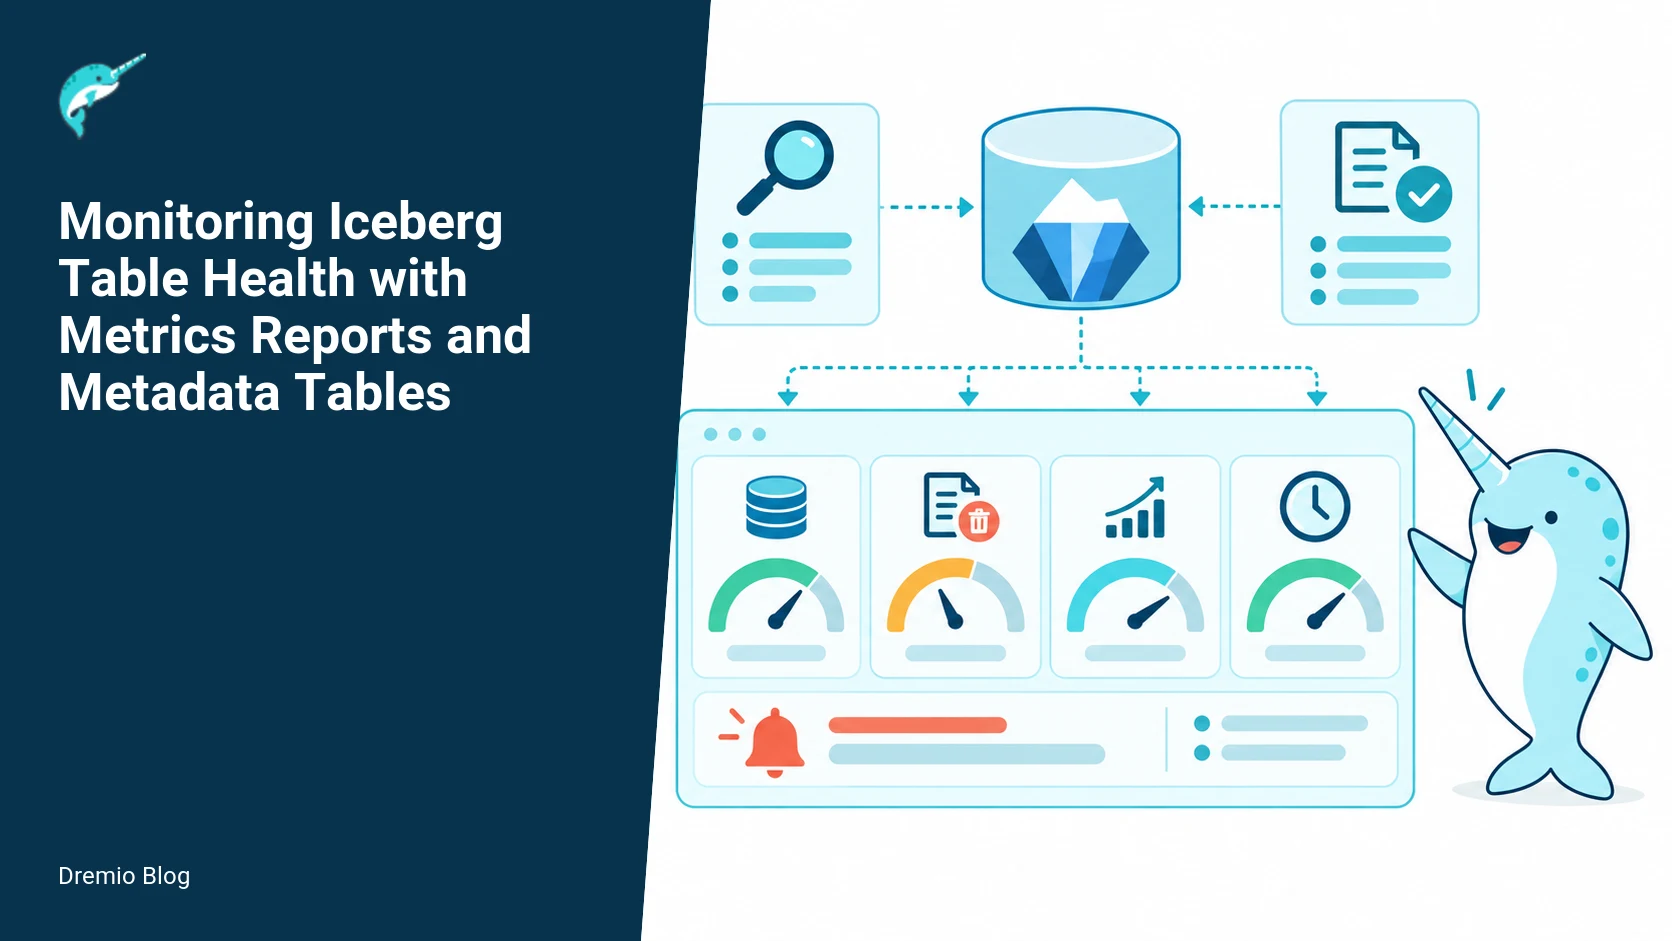
Healthy Iceberg monitoring combines client-side metrics reports with recurring metadata-table queries. Use ScanReport and CommitReport to capture planning, filtering, and write outcomes. Use the metadata tables to query file sizes, delete-file pressure, snapshot growth, and manifest shape. Together these signals let you set SLOs for snapshot freshness, commit reliability, planning latency, and maintenance debt, and they let you detect trends before query latency or storage bills spike.
How metrics reports and metadata tables complement each other
Metrics reporters run in clients, which means the first place you will see writer and reader behavior is inside the process that opened the table. Metrics reports capture what happened during planning and commit, including rejected filters, rows scanned, and commit failures. Metadata tables, queried from a central engine, show the persistent physical state: file counts, file sizes, delete-file density, manifest counts, and snapshot chains. Both are necessary. Metrics show timing and intent, metadata shows accumulation and longterm cost.
Important technical cautions. Metrics reporters run in clients, and their names and payloads vary by implementation version. Verify the reporter implementation and payload schema for your Iceberg library version. Thresholds you set must follow workload baselines; do not copy absolute values from another environment without calibration.
Signals from client to dashboard. Each stage has a result that can be checked before the next stage begins.
Signals and flow: from client to dashboard
Think of three signal layers.
Client metrics, sent at the time of planning or commit. These include ScanReport and CommitReport payloads. They are the fastest signals for detecting user-facing failures and planning regressions.
Prometheus or pull metrics derived from the reporters. Convert important numeric fields into time series and expose them on your metrics backend for alerts and dashboards.
Metadata-table queries, run periodically. These are heavier, but authoritative. Use them for weekly or hourly jobs that compute file-size histograms, small-file ratios, delete-file density, and snapshot churn.
On the implementation side, collect ScanReport and CommitReport via the reporter your client supports. Apache Iceberg documents a REST based reporter, and library-specific bindings exist for Spark and Flink. For a Java environment, RESTMetricsReporter is a shipped example that shows configuration properties and a simple HTTP sink. Use that as your starting point, but verify the reporter properties for your Iceberg version because names and payloads changed across releases. See the official metrics reporting guide for the version you run for exact property names.
Four table-health SLOs to track
These SLOs focus on ongoing observability, not one-time audits. They map directly to the signals above and to operational actions.
Four table-health SLOs. Each technical risk needs a matching test, boundary, or operating signal.
Snapshot freshness, objective: median snapshot age under X minutes, 99th percentile under Y minutes. This maps to freshness for streaming or near-real-time data sources. Track snapshot_time differences via metadata snapshots and the commit report timestamps.
Commit reliability, objective: commit success rate above 99.9 percent over a 24 hour window. Use CommitReport outcomes from clients and cross-check commit success in metadata by verifying snapshot growth matches writes.
Planning latency and predicate pushdown, objective: median planning time under P ms, and the fraction of scans with successful filter application above Q percent. ScanReport shows how many rows and files were considered after planning and filtering; that answers whether predicate pushdown is effective.
Maintenance debt, objective: small-file ratio and delete-file pressure under configured thresholds. Metadata tables show file-size histograms and delete-file counts. Set thresholds based on your baseline because acceptable small-file ratios vary by workload.
Which metadata tables and queries to run
Iceberg exposes metadata tables that can be queried like normal tables. The Spark-specific queries in the Iceberg documentation show how to extract file and snapshot information. Use those queries as the basis for automated jobs. I recommend running these queries hourly for large clusters and every few minutes for critical low-latency tables.
Example health queries, adapted from the documented Spark queries. Verify syntax against your engine and Iceberg version before running.
<!-- wp:code --><code>-- 1. File-size distribution per table
SELECT
  bucket(file_size, 0, 256*1024*1024, 10) AS size_bucket,
  count(*) AS file_count,
  sum(file_size) AS total_bytes
FROM table_name.files
GROUP BY size_bucket;

-- 2. Delete-file pressure: ratio of delete-files to data-files
SELECT
  sum(case when file_type = 'data' then 1 else 0 end) AS data_files,
  sum(case when file_type = 'delete' then 1 else 0 end) AS delete_files,
  delete_files * 1.0 / nullif(data_files, 0) AS delete_to_data_ratio
FROM table_name.manifests_files;

-- 3. Snapshot growth rate
SELECT
  snapshot_id,
  committed_at,
  row_count_delta,
  file_count_delta
FROM table_name.snapshots
ORDER BY committed_at DESC
LIMIT 100;

-- 4. Manifest and manifest-list shape
SELECT
  manifest_path,
  added_snapshot_id,
  deleted_data_files,
  added_data_files,
  deleted_files_count
FROM table_name.manifests;
</code><!-- /wp:code -->
These example queries reference the metadata table names shown in the Apache Iceberg Spark queries guide. If you run queries from Dremio, treat the Dremio examples on querying internals as a practical how-to for connecting a SQL engine to those metadata tables. The Dremio blog post about querying internals explains how to reach internal metadata tables for analysis, which is useful when you want a centralized audit job across many tables.
Worked example: RESTMetricsReporter properties
RESTMetricsReporter is a common example implementation in Iceberg documentation. It shows the basic properties to configure an HTTP sink for metrics. Do not assume property names are identical across versions. Check the metrics reporting documentation for your Iceberg release. The official site documents a REST reporter and provides sample configs for various clients.
<!-- wp:code --><code># Example RESTMetricsReporter properties, verify these exact keys for your Iceberg version
metrics.reporter.rest.class=org.apache.iceberg.metrics.rest.RESTMetricsReporter
metrics.reporter.rest.endpoint.http://metrics-collector.internal.local/iceberg
metrics.reporter.rest.timeout.ms=5000
metrics.reporter.rest.batch.size=50
metrics.reporter.rest.include.scan-report=true
metrics.reporter.rest.include.commit-report=true
</code><!-- /wp:code -->
What to verify after you add these properties.
That the client process emits HTTP calls for ScanReport and CommitReport at the expected times. Use tcpdump or your HTTP logs to confirm payloads.
That your collector reliably returns 200. REST reporters often retry; measure retry counts and latencies to catch backpressure in the collector.
That the payload shape includes fields you plan to chart. Names like filesExamined, rowsScanned, commitSuccess are common, but check the exact schema in your version documentation.
Worked example: health queries you can schedule
Pick an automation cadence based on table activity. For very active tables pick 1 to 5 minute runs. For ad hoc analytics tables hourly is often enough. Below are practical queries you can run as scheduled jobs and push into Prometheus or your observability backend.
<!-- wp:code --><code>-- Small file ratio, as a percent
WITH stats AS (
  SELECT
    count(*) FILTER (WHERE file_size < 134217728) AS small_files,
    count(*) AS total_files
  FROM table_name.files
)
SELECT small_files * 100.0 / nullif(total_files, 0) AS small_file_percent FROM stats;

-- Average file size
SELECT avg(file_size) AS avg_file_bytes FROM table_name.files;

-- Delete-file density per partition (example partition column: ds)
SELECT
  ds,
  sum(case when file_type = 'delete' then 1 else 0 end) AS delete_files,
  sum(case when file_type = 'data' then 1 else 0 end) AS data_files,
  delete_files * 1.0 / nullif(data_files, 0) AS delete_to_data_ratio
FROM table_name.manifests_files
GROUP BY ds;
</code><!-- /wp:code -->
Translate these results into timeseries by running them every minute and emitting the numeric result to Prometheus pushgateway, or by inserting results into a metrics table. The Spark queries documentation at Iceberg explains the metadata schema you will read, which helps you tailor these queries for your engine.
Worked example: Prometheus alert rules
Below are Prometheus rule templates. Replace threshold numbers with baseline-driven values. These alerts assume you convert the query outputs into Prometheus metrics named ice_*. The exact metric names depend on how you instrument the scheduled jobs.
<!-- wp:code --><code># 1. Small file percent too high for the last 30m
- alert: IcebergHighSmallFileRatio
  expr: avg_over_time(ice_table_small_file_percent[30m]) > 40
  for: 15m
  labels:
    severity: page
  annotations:
    summary: "High small-file ratio for {{ $labels.table }}"
    description: "Small files >40% for 30m, indicates compaction needed"

# 2. Delete-file pressure increase
- alert: IcebergHighDeleteToDataRatio
  expr: max_over_time(ice_table_delete_to_data_ratio[1h]) > 0.5
  for: 30m
  labels:
    severity: ticket
  annotations:
    summary: "High delete to data file ratio for {{ $labels.table }}"
    description: "Delete files exceed 50% of data files, triggers VACUUM/expire snapshots"

# 3. Commit error spike as reported by clients
- alert: IcebergCommitFailureSpike
  expr: increase(ice_commits_failed_total[15m]) > 5
  for: 5m
  labels:
    severity: page
  annotations:
    summary: "Spike in commit failures for {{ $labels.table }}"
    description: "Detects client-side commit failures from metrics reports"
</code><!-- /wp:code -->
Prometheus rules assume you have converted ScanReport and CommitReport fields into metrics. When configuring the conversion, remember that reporter field names can change across Iceberg versions. Confirm the field names in your collector or the original reporter payloads. The official metrics reporting guide for your Iceberg release lists common payload fields and is the source of truth.
Alert flow for small-file and delete-file pressure
Alerts should map to an automated checklist and, where safe, automated remediation. For small-file and delete-file pressure, you can often run maintenance jobs automatically, but only after you verify safe conditions like cluster load and snapshot consistency.
Small-file and delete-file alert flow. The loop turns table or catalog signals into controlled operational changes.
Detection: Prometheus fires IcebergHighSmallFileRatio or IcebergHighDeleteToDataRatio.
Automated preflight: run a quick metadata query to confirm current file counts, average file size, and active writers. If writers are active, defer aggressive compaction.
Escalation rule: if ratio remains above threshold for N checks and no active writers, create a maintenance ticket and optionally kick off a compaction/merge small files job with rate limiting.
Post-maintenance verification: re-run the health queries and verify small-file percent dropped and snapshot growth is stable. If delete-file ratio was the issue, run snapshot expiration and orphan file cleanup as described in the Dremio posts on snapshot expiration and orphan file cleanup. Those pages show the kinds of maintenance steps and caveats to expect when purging snapshots and deleting files.
Failure modes and what they look like
Here are realistic failure modes, what emits them, and how to verify them.
Reporter misconfiguration, symptom: no metrics reach your collector. Cause: wrong reporter class or wrong endpoint. Verify client logs for reporter instantiation and run a packet capture to confirm HTTP attempts. Confirm property names against your Iceberg version documentation.
Metric-field drift, symptom: dashboards show NaN or missing series. Cause: reporter payload changed field names between versions. Fix: inspect raw payloads and update your metric mapping. The Iceberg metrics reporting guide lists common fields per version.
Commit latency and backpressure, symptom: rising commit retry counts and longer commit latencies. Source: collector or network slowness, or heavy snapshot operations. Check client-side CommitReport timings and your collector's 5xx rate. Measure retry counts before paging on-call.
Maintenance jobs failing to reduce debt, symptom: small-file ratio unchanged after compaction. Cause: new writers creating small files faster than compaction speed, or partition skew. Fix: throttle writers if possible, increase compaction throughput, or change partitioning to reduce skew.
Incident triage sequence
When an alert pages, follow a short, repeatable triage sequence. Keep it simple so engineers can act under pressure.
Incident triage sequence. A reversible canary keeps an unsupported client or unsafe policy from becoming a fleet-wide incident.
Verify the alert by checking the latest client metrics and metadata queries. Confirm whether the signal is recent or a reporting lag artifact.
Identify the scope: a single table, a partition range, or cluster-wide. Use metadata tables to list affected partitions and manifest counts.
Check active writer counts and commit rates from CommitReport metrics. If writers are active and committing, prefer controlled maintenance with traffic shaping. If no writers are active, a maintenance window is safer.
Decide remediation: schedule compact/optimize job, expire snapshots, or increase collector capacity. If commit failures are the issue, prioritize fixing the commit path first because incorrect compaction may destroy recent writes if snapshots are inconsistent.
After remediation, run the health queries again and confirm the SLOs. Capture metrics for the run and for the subsequent 24 hours to ensure the fix held.
Rollout checklist for adding Iceberg health monitoring
Inventory tables with write rates and criticality. Focus initial monitoring on the top N tables by writes or critical reports.
Pick a reporter and confirm the exact property names for your Iceberg client version. Consult the Iceberg metrics reporting docs for your version to avoid surprises.
Stand up a metrics collector and map reporter payload fields into meaningful Prometheus metrics. Verify payloads from a staging client first.
Create scheduled jobs to run the metadata-table health queries. Start with hourly cadence, then increase frequency for hot tables.
Create Prometheus alert rules from the scheduled-job outputs. Calibrate thresholds from a 7 to 14 day baseline.
Define remediation playbooks for each alert class, including safe preflight checks, and automate the non-destructive steps where possible.
Run a simulated incident drill for a table showing high small-file ratio and measure time to remediate and to verify.
What to measure after deployment
After you deploy monitoring, treat these as the primary operating metrics. Measure them continuously and track trends.
Alert volume and noise, measure alerts per table per week. High noise means your thresholds are not matched to baseline and require tuning.
Time to detect and time to remediate, measure median and 95th percentile. These relate directly to SLO fidelity and operational cost.
Commit success rate, derived from CommitReport metrics and snapshot confirmation. Watch for regressions after client or collector upgrades.
Small-file percent and delete-file ratio, the two maintenance debt signals. Track both the current value and change rate over 24 hours.
Query planning latency, based on ScanReport planning time. Correlate with rows/files examined to find regressions in predicate pushdown.
Limits, versioning, and verification steps
Do not assume identical behavior across Iceberg versions. Metric names and payloads vary by implementation version. Always verify the reporter class and payload schema for the version you run by consulting the metrics reporting page for that version. For Spark the documented queries for metadata tables indicate column names and internal table names that may differ by engine and Iceberg release. I checked the references below on September 22, 2026 for guidance on these differences, but you must confirm the exact keys and table names in your environment.
Verification steps to run before relying on monitoring:
From a staging client, enable the reporter and confirm HTTP payloads or metric emissions. Capture an example ScanReport and CommitReport to a log file for schema inspection.
Run the metadata-table queries against a test table to confirm column names and types. Adjust your queries to match your engine.
Calibrate thresholds using a 7 to 14 day baseline of collected metrics, then deploy alerts in notify-only mode for one week to measure false positives.
Upgrade process: when you upgrade Iceberg or your client, treat reporter schema changes as breaking changes for monitoring. Re-validate payloads immediately after an upgrade.
Cross-links to Dremio posts that help with specific tasks
For practical how-tos when you are analyzing metadata tables from a SQL engine, see the Dremio blog post on Apache Iceberg metadata tables. That post shows concrete examples of reading files, manifests, and snapshots with SQL, which helps build the automated health queries mentioned above.
When deciding how to expire snapshots safely, read the Dremio piece on snapshot expiration. It explains risks and policies you should consider before automated snapshot pruning.
If you decide to delete orphan files or implement vacuuming after snapshot expiration, the Dremio orphan file cleanup post contains the operational steps and precautions for safely removing data files that are no longer referenced.
For general platform context about running Iceberg at scale with a modern SQL engine, the Dremio platform page provides guidance on integration patterns and performance considerations. Use it to map the monitoring signals into platform-level operational playbooks.
Practical evaluation sequence you can run in one day
Do this sequence in a staging environment. Expect 3 to 6 hours for setup and a few hours of data collection. The goal is to validate end-to-end telemetry and demonstrate a full detection-to-remediation cycle.
Enable RESTMetricsReporter (or your chosen reporter) on a staging writer. Confirm HTTP payloads for ScanReport and CommitReport and capture two sample payloads.
Run scheduled metadata queries once and validate column names and results. Store outputs in a small results table so you can map them to Prometheus metrics later.
Instrument a conversion job that converts the query outputs into Prometheus metrics, or push them to your metrics backend. Create one dashboard with: small_file_percent, delete_to_data_ratio, avg_file_size, commit_failures, planning_time_ms.
Create the three alerts above with conservative thresholds. Put them in notify-only mode for an hour, then move to active paging for a simulated issue.
Simulate a small-file problem by writing small files to the table from a writer and watch the small_file_percent rise. Run the automated preflight and then kick off compaction. Measure time to detection and remediation.
Document the run and adjust thresholds, remediation scripts, and preflight checks based on the results.
Implementing a controlled rollout and test harness for RESTMetricsReporter
Put simply, do not flip client metrics on for all writers at once. Start with a small, representative set of writers, validate payload format and payload volume, then expand. Below I give a concrete, staged rollout plan and a short test harness you can run in a controlled environment. The examples reference RESTMetricsReporter properties as documented by the Iceberg reporters pages. Verify the reporter property names in your client implementation and Iceberg version before applying them in production.
Stage 0: smoke test on a dev cluster. Configure one job or one Spark executor to emit metrics to a local HTTP sink you control. Confirm the reporter can reach the endpoint and the payload matches your parser expectations. Check for increased commit latency or unexpected exceptions in client logs.
Stage 1: 1 percent production traffic. Add the RESTMetricsReporter properties to a single task type that represents about 1 percent of your writes. This catches issues that only appear on production data while limiting blast radius. Collect traces and metrics for a few hours to cover peak writes.
Stage 2: 10 percent production traffic. Expand to 10 percent if Stage 1 is stable. Validate aggregated cardinality of metrics, monitor your metrics ingestion pipeline backing Prometheus and your metrics store for increased CPU and retention cost.
Stage 3: broad rollout. Gradually enable for all writers that produce new Iceberg table changes. Keep an eye on a few signals described below. If any signal degrades beyond a short lookup table, roll back to the prior stage.
RESTMetricsReporter properties to test and their operational consequences
metrics.reporter or equivalent property name, depending on client. This selects the reporter implementation. If misconfigured, clients may silently skip metrics or throw at startup.
metrics.reporter.rest.endpoint, sometimes named rest.endpoint in specific builds. This is the HTTP endpoint that receives the POSTs. Ensure the endpoint is reachable and authenticated if required. An unreachable endpoint should be handled gracefully, but verify implementation behavior for your Iceberg client version.
metrics.reporter.rest.headers, if present, allows configuring authorization headers. Validate that the reporter redacts secrets in logs and never logs full tokens.
metrics.reporter.rest.payload-type or format selector, where supported. Test both compact and verbose payloads if the client exposes them. Verbose payloads make debugging easier but increase network bandwidth and metric ingestion cost.
metrics.reporter.batch.size and metrics.reporter.batch.interval, when available. Batching reduces request load but increases tail latency for metric availability.
Operational consequences to verify during the rollout:
Client commit latency changes. Measure median and 95th percentile commit durations with and without the reporter.
Request volume and size to your metrics endpoint. Small misconfigurations can multiply requests across executors.
Metric cardinality. If writers include high-cardinality tags like hostnames, you may blow through Prometheus label limits.
Error handling. Confirm the reporter retries sensibly and does not block or crash writing tasks when the endpoint is slow or returns errors.
All properties above may differ in name or availability by Iceberg or integration version. Check the Iceberg 1.6.0 documentation and the general metrics reporting reference for exact names and behavior. The test harness and staged rollout let you confirm actual behavior in your deployed client library version.
Simple test harness you can run in one hour
This harness uses a lightweight HTTP collector that logs each POST to disk, and a sample writer job that commits a small number of Iceberg writes. The goal is to validate payload shape, size, and error handling.
1) Start a collector. Any simple HTTP server works. For example, a minimal Python Flask app that writes requests to a file. Ensure you replace the import and run commands with what your environment allows. Confirm the server returns 2xx for valid requests.
2) Configure one writer to use the RESTMetricsReporter endpoint. Set batch size to 1 and interval to a small value while testing so you see immediate traffic. Capture the writer logs and the collector output simultaneously.
3) Execute a sequence of commits that mirror production write patterns, for example bulk loads, small updates, and delete operations. Compare the collector logs to the expected metric names from the Iceberg metrics reporting docs. Pay attention to which fields are present only on commit failures or compactions.
4) Induce a simulated outage of the collector and watch the writer behavior. Does the writer queue messages, retry, or drop metrics? Check for exceptions and increased latencies. This test reveals how tolerant the reporter is to temporary outages.
5) Validate size and cardinality. Save a few POST payloads and compute statistics: average payload size, number of unique label keys, and top label cardinalities. Use these numbers to estimate Prometheus label usage and store costs when scaling to all writers.
Failure injection tests and expected failure-mode signatures
Running failure injection tests before production rollout is the difference between a recoverable incident and a production outage. Below are concrete fault injections you can run, the exact things to measure, and the expected signatures in logs, Prometheus, and metadata tables. These tests assume you can control the reporter endpoint and the writer process.
Test A: endpoint slow responses
How to inject: configure the collector to sleep for N seconds on each incoming request. Test N values at 100 ms, 500 ms, and 2000 ms. Run a moderate write workload during each test.
What to measure: median and 95th percentile commit latency, error rate in writer logs, number of dropped metrics reported by the collector, and Prometheus scrape delays if you proxy metrics through an agent.
Expected signatures: if the reporter is synchronous, you will see commit latency increase proportionally to the added response time. If it is asynchronous with a bounded queue, you may see queue full errors in logs and dropped metrics. In Prometheus, missing metric samples or a sudden drop in metric volume are signs the reporter is failing to deliver.
Test B: intermittent 5xx errors
How to inject: have the collector return HTTP 500 for 1 in 10 requests. Use deterministic patterns so you can correlate failed POSTs to specific writer commits.
What to measure: rate of retries, retry backoff behavior, whether retries block commit completion, and whether failed POSTs surface as exceptions. Check whether the client logs include stack traces or note suppressed telemetry errors only.
Expected signatures: repeated 5xx responses should increase retries and possibly exponential backoff. If retries are synchronous, expect longer commit times and potential backlog on the writer. If retries are asynchronous, you may see accumulating queued reports. Look for elevated memory use in writer processes when queueing grows.
Test C: malformed payload rejection
How to inject: change the collector to validate expected JSON schema and return 400 on mismatch. Simulate a reporter version mismatch or a bug that omits fields to trigger 400 responses.
What to measure: whether the writer logs the payload error, whether it stops emitting metrics, and whether future payloads are accepted after correcting the schema. Also, check downstream parsers that may assume certain fields exist.
Expected signatures: schema errors usually indicate reporter/client-version drift. You will see 400 responses in the collector and possibly an immediate drop in metric samples or rapid error lines in writer logs. Fixing the reporter version or adjusting the collector to accept both formats usually resolves the issue.
Correlating failures with metadata table signals
Metrics reporter failures do not immediately change Iceberg metadata tables. But they do make troubleshooting harder. When you see missing metrics, use metadata table queries to detect symptoms that metrics would otherwise show, such as rapid growth in file count or large number of delete files. Run the health queries you already have scheduled and compare their results during the failure injection to the collector logs. If metadata tables show problems but metrics are absent, prioritize fixing the reporter ingestion path.
Decision table for alerts, escalations, and automated responses
Alerts should map to human and automated actions. The following decision table maps combinations of Prometheus alert conditions, metadata table results, and recommended response. Adapt thresholds to your baseline and verify that the example Prometheus rules you included in the draft align with these actions.
Columns are intentionally concrete: alert, metadata verification query, immediate action, escalation, and automated remediation candidate.
Alert: High small-file rate alert fires continuously for 10 minutes.
Metadata verification: Run the small-file health query to count files smaller than your minimal file size across recent snapshots.
Immediate action: Pause noncritical streaming writers or throttled jobs. Inform the on-call engineer to verify ingestion topology.
Escalation: If counts remain high for 30 minutes despite throttling, escalate to storage and SRE teams.
Automated remediation candidate: Automated job to compact small files for targeted partitions if compaction is safe for your workload and you have a tested compaction job.
Alert: Delete-file pressure alert triggers (high delete-file per partition ratio).
Metadata verification: Run the delete-file health query to compute delete-file-to-data-file ratio and recent delete-file growth.
Immediate action: Temporarily pause large-scale deletes or reprocess the upstream job that issues deletes.
Escalation: If the ratio exceeds a fixed threshold for 60 minutes, involve the data owner and run a reconciliation job to identify sources of noisy deletes.
Automated remediation candidate: Schedule targeted rewrite tasks that rewrite out deleted rows for affected partitions after a manual signoff.
Alert: Missing metrics volume from reporters, or sudden drop in metric cardinality.
Metadata verification: Compare metadata table snapshots count and file growth to historic baseline. If metadata shows problems, act on Iceberg issues. If metadata is fine, likely a reporter ingestion issue.
Immediate action: Investigate metrics endpoint health and writer-side logs for reporter errors. Rollback recent reporter configuration changes if present.
Escalation: Escalate to the team owning the metrics ingestion pipeline and the client library maintainers if you identify a version mismatch.
Automated remediation candidate: Switch reporters to a fallback endpoint or enable a queueing proxy that buffers POSTs during ingestion outages.
Alert: Prometheus scraping of aggregated metrics exceeds storage or query SLA.
Metadata verification: Run queries to identify high-cardinality tags in recent reporter payloads saved to log storage. Confirm whether high cardinality corresponds to expected host or job-level tags.
Immediate action: Temporarily limit reporter emission or adjust reporter configuration to drop high-cardinality labels.
Escalation: Involve cost owners and rearchitect the telemetry collection to aggregate at job-level rather than host-level.
Automated remediation candidate: A rate-limiter on the telemetry ingress that drops lower priority labels when cardinality exceeds a threshold.
Each action requires a verified rollback plan. For automated remediation, ensure you test and document the safety of any automated compaction or rewrite. Never auto-run a global rewrite without human approval and a tested rollback path.
Concrete Prometheus rule mapping examples and how to tune them
Your draft includes Prometheus alert examples. Here are tuning suggestions tied to specific operational consequences, so they are actionable.
Alert: small_file_rate_high. Tune the duration window to match your write burstiness. For batch-heavy systems, prefer a 1 hour window to avoid alert storms. For streaming-heavy systems, use 5 to 15 minutes.
Alert: delete_file_pressure. Use a ratio over a rolling 24 hour window for slowly evolving tables, and a 1 hour window for high-frequency delete workloads. Ratio thresholds must be based on historical percentiles for the table; pick 95th percentile as a safe starting point for breakpoints.
Alert: metrics_ingest_volume_drop. Set this alert to detect a statistically significant drop versus the trailing seven day average. Use at least 3 standard deviations to avoid false positives from maintenance windows.
For each rule, include runbook links in the alert annotations. The runbook should point to the metadata queries that validate the condition, and to the staged rollback steps for reporter configuration.
Prometheus examples to add: verification rules and silence automation
Beyond firing alerts, add verification rules that help you triage. For instance, a rule that computes the ratio of metric series emitted per writer type helps locate a missing reporter deployment. Another rule that checks payload size averages can catch format regressions early.
Finally, ensure your alerting platform can silence alerts based on maintenance windows or deployment tags. If you perform a planned rollout of reporters, schedule silences in advance to avoid alert floods from expected metric volume changes.
Operational metrics to measure continuously and their target ranges
Metrics without targets are noise. Below are practical operational metrics to measure after deployment, how to calculate them, and suggested starting targets. Tune these to your workload baseline and validate before making automated decisions.
Commit latency delta, measured per writer: median and p95 of commit duration with reporter enabled minus reporter disabled. Target: median delta under 10 ms, p95 under 100 ms for most batch jobs. If your workload is latency sensitive, set stricter limits.
Reporter error rate, ratio of non-2xx responses from the metrics endpoint over total reporter requests. Target: under 0.1 percent over a rolling 1 hour window. Higher rates indicate endpoint problems or schema mismatches.
Metric cardinality, unique label combinations per table per day. Target: keep below 10k series per high-volume table in Prometheus to avoid slow queries and excessive storage. If your Prometheus backend supports higher cardinality, recalibrate accordingly.
Payload size, average bytes per POST. Target: keep average POST under 16 KB to avoid networking inefficiencies and to stay friendly to ingress proxies. If verbose payloads are needed for debugging, enable them temporarily and track the increase.
Metadata-table refresh lag, time between a commit and its appearance in the metadata table snapshot results (for queries that rely on snapshot timestamps). Target: under 2 minutes for near-real-time health queries; verify behavior for the Iceberg version and the query engine you use.
Label each metric with the table name, environment tag, and writer role when possible. This lets you filter noise from background tasks and focus on critical paths.
Label cardinality is the biggest practical risk. If you discover the cardinality target is too low, consider sampling reporters, aggregating labels at job-level, or moving high-cardinality telemetry into a separate, high-capacity store.
Facts checked on September 22, 2026: Iceberg metrics reporting behavior and the documented reporter properties vary by client and version. Confirm property names with the Iceberg 1.6.0 metrics reporting documentation and the general metrics reporting reference linked in Sources.
These new sections are designed to slot into the draft before the FAQ. They add a concrete staged rollout, a quick test harness, failure injection tests, a decision table for alerts and automations, and a compact set of operational metrics with starting targets. They expand the practical material already present in your draft and give an operator actionable steps to validate and tune Iceberg metrics reporting at scale.
FAQ
How often should client metrics be emitted?
Emit ScanReport and CommitReport per query and per commit respectively. These reports are generated at the time of planning and commit. Do not batch them beyond what the reporter supports because that loses timing fidelity for debugging.
Do metrics reporters add latency to commits?
Reporters typically emit asynchronously or in a separate thread, but configuration matters. RESTMetricsReporter variants may batch or sync; check the reporter implementation and measure commit latency with and without the reporter enabled.
Can I rely only on metadata tables and skip client metrics?
No. Metadata tables show the persistent state but not planning decisions or transient failures. CommitReport and ScanReport capture the operational timing and intent that metadata alone cannot show, such as failed commits or ineffective predicate pushdown.
What thresholds should I use for small-file alerts?
Thresholds must follow workload baselines. Start by measuring current small_file_percent over 7 to 14 days, then set alert thresholds at a multiple of the normal variance, and tune down after a week of false positives.
How do I handle metric name changes across Iceberg versions?
Validate raw payloads after any upgrade. Keep a mapping table of field names per Iceberg version. When upgrading, run validation tests that exercise metrics emission before promoting the change to production.
Which Dremio article explains how to query metadata tables?
See the Dremio blog post on Apache Iceberg metadata tables for concrete SQL examples. It shows how to read files, manifests, and snapshots from a SQL engine, which you will need to implement the scheduled health queries described above.
Related Dremio guides
These guides cover adjacent implementation details that are outside this article's main scope.
Intro to Dremio, Nessie, and Apache Iceberg on Your Laptop
Editor’s note, September 2026. This post was published in September 2023 and some product details have changed since. Nessie is still available and self-deployable under the Apache-2.0 licence, and it remains the clearest implementation of catalog-level branching. It is not an Apache Software Foundation project, and its development has slowed considerably. For how the current […]
Aug 16, 2023·Dremio Blog: News Highlights
5 Use Cases for the Dremio Lakehouse
With its capabilities in on-prem to cloud migration, data warehouse offload, data virtualization, upgrading data lakes and lakehouses, and building customer-facing analytics applications, Dremio provides the tools and functionalities to streamline operations and unlock the full potential of data assets.
Sep 30, 2026·Dremio Blog: Open Data Insights
Apache Iceberg 1.12.0: What’s New, Breaking Changes, and Upgrade Guide
Apache Iceberg 1.12.0 expands v3 engine support, REST catalog operations, streaming reliability, and v4 groundwork. Learn how to upgrade safely.