Intro
In this tutorial, we are going to demonstrate a pipeline of working with data stored in Azure Blob Storage using Dremio and Qlik Sense.
Qlik Sense is a tool for data analytics and visualization. The platform supports different types of data visualization and provides impressive interactivity features. It allows easy sharing of the completed work and collaboration during the new projects development. Users can explore and prepare graphs and analytics reports both in the cloud, locally, and even using mobile devices.
Azure Blob Storage is a cloud solution for storing big unstructured data. It provides a lot of useful features, but the main of them are the ability to access your data from any place as well as high scalability and flexibility.
The dataset we are going to use is the 2016 Legatum Prosperity Index dataset. We don’t use all the data available there. For demonstration purposes, we select only one sheet of the excel spreadsheet file.
Assumptions
In this tutorial, we assume that you have access to the following tools:
- Dremio 3.2
- Azure account
- Qlik Sense Desktop
- Dremio Connector
Azure Blob Storage preparation
First of all, we need to prepare Azure Blob Storage for using and then upload the data to it. In Azure, a storage account should be associated with a resource group.
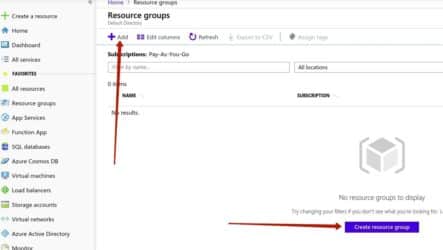
Here we create a resource group called prosperity. To do this, we need to select the Resource groups tab in the left-side menu and click the Add button.

Next, give the name to the resource group, click the Review + create button, and then the Create button.

Now we need to create a storage account. Go to All services → Storage → Storage account → Add. Fill the form for the new storage account creation. Give it a name and choose the BlobStorage option as the account kind. Press the Review + create button, and then Create.

After that, you should see the created account in the list of accounts. Note that the kind of the prosperitydremio storage account is the BlobStorage:

Go to the created storage account and click on the Blobs tab:

In Azure Blob Storage, data is stored inside the containers. So, we should create a container prior to the data uploading. Click on the + Container button:

Give a name to the new container (we choose the prosperitycontainer name):

After you create the container, you should go inside it and use the Upload button to copy the files from your local machine to the Azure Blob Storage. We want to upload 2 files - pi.csv and rank_pi.csv. Here is the result:

Now we are ready to consume data from Azure Blob Storage. Let’s connect it to Dremio.
Azure Blob Storage and Dremio connection
On the Dremio UI home page, click on the button responsible for the new source addition and choose the Azure Storage. This option can be used to connect both Azure Blob Storage and Azure Data Lake Storage Gen2 to Dremio. The process is identical.

Fill in the following form:

To find the Shared Access Key, go to your storage account using the Azure portal and select the Access keys tab. Use the key1:

Then, press the Save button in Dremio and wait until the connection is established.
Data curation in Dremio
Now we can start data curation in Dremio. First, go inside each file and ensure that the Line Delimiter is specified as needed and the _Extract Field Names _ checkbox is checked:

Then, go to one of the files (for example, pi.csv) and click Join:

Select the other file with which you want to join the current file (in our case, rank_pi.csv):

On this step, you need to specify the columns which will be used to join the files (country in our case):

Now, the dataset is joined. We can drop one of the country columns because they are duplicates. You can drop a column by clicking on the little arrow near its name and selecting Drop option from the menu:

We want to change the datatypes of the columns in our dataset because they all are of string (text) type, but we can see that there are many integers and float values. So, let’s start from integer columns and change the type of these columns by clicking on the Abc buttons near their names and selecting the needed type (Integer):

By the way, each action which you perform with a dataset in Dremio is represented as a dot on the right side of the window:

At the same time, we have a little problem with converting actual float values to float data type. That values are represented in our dataset as numbers with commas as separators of integer and float part. But when trying to convert them to float, we got null values because the system doesn’t recognize commas as the separator. It needs dots as separators instead. So, we need to replace commas by dots. To do this, click on the little arrow near the name of the column to call drop-down menu. In this menu, select Replace Text:

On the next window, in the Edit Selection part, specify comma “,”. Below, specify the dot “.” as the Replacement value. Also, choose Text Selection from the drop-down menu to replace only the comma but not the entire value. On the table below, you will be able to see a preview of the changes your actions will lead to.

We have performed similar actions for each of the columns we needed to convert to float datatype. After we replaced commas by dots, there were no other issues with type changing for these columns.
You can see that the drop-down menu which you can evoke by clicking on the arrow button near the column name provides many different features. For example, you can sort dataset by the specific column (maybe you want to see the countries with the highest prosperity index at the top, for instance).
In Dremio, all that you do with a dataframe have the reflection in SQL query. By clicking on the SQL Editor switch, you will be able to see the query created by your actions:

We got the following SQL query:
SELECT CONVERT_TO_FLOAT
(CASE WHEN regexp_like(nested_0.PI2007, '.*?\Q,\E.*?')
THEN regexp_replace(nested_0.PI2007, '\Q,\E', '.')
ELSE nested_0.PI2007 END, 1, 1, 0) AS PI2007,
CONVERT_TO_FLOAT(CASE WHEN regexp_like(nested_0.PI2008, '.*?\Q,\E.*?')
THEN regexp_replace(nested_0.PI2008, '\Q,\E', '.')
ELSE nested_0.PI2008 END, 1, 1, 0) AS PI2008,
CONVERT_TO_FLOAT(CASE WHEN regexp_like(nested_0.PI2009, '.*?\Q,\E.*?')
THEN regexp_replace(nested_0.PI2009, '\Q,\E', '.')
ELSE nested_0.PI2009 END, 1, 1, 0) AS PI2009,
CONVERT_TO_FLOAT(CASE WHEN regexp_like(nested_0.PI2010, '.*?\Q,\E.*?')
THEN regexp_replace(nested_0.PI2010, '\Q,\E', '.')
ELSE nested_0.PI2010 END, 1, 1, 0) AS PI2010,
CONVERT_TO_FLOAT(CASE WHEN regexp_like(nested_0.PI2011, '.*?\Q,\E.*?')
THEN regexp_replace(nested_0.PI2011, '\Q,\E', '.')
ELSE nested_0.PI2011 END, 1, 1, 0) AS PI2011,
CONVERT_TO_FLOAT(CASE WHEN regexp_like(nested_0.PI2012, '.*?\Q,\E.*?')
THEN regexp_replace(nested_0.PI2012, '\Q,\E', '.')
ELSE nested_0.PI2012 END, 1, 1, 0) AS PI2012,
CONVERT_TO_FLOAT(CASE WHEN regexp_like(nested_0.PI2013, '.*?\Q,\E.*?')
THEN regexp_replace(nested_0.PI2013, '\Q,\E', '.')
ELSE nested_0.PI2013 END, 1, 1, 0) AS PI2013,
CONVERT_TO_FLOAT(CASE WHEN regexp_like(nested_0.PI2014, '.*?\Q,\E.*?')
THEN regexp_replace(nested_0.PI2014, '\Q,\E', '.')
ELSE nested_0.PI2014 END, 1, 1, 0) AS PI2014,
CONVERT_TO_FLOAT(CASE WHEN regexp_like(nested_0.PI2015, '.*?\Q,\E.*?')
THEN regexp_replace(nested_0.PI2015, '\Q,\E', '.')
ELSE nested_0.PI2015 END, 1, 1, 0) AS PI2015,
CONVERT_TO_FLOAT(CASE WHEN regexp_like(nested_0.PI2016, '.*?\Q,\E.*?')
THEN regexp_replace(nested_0.PI2016, '\Q,\E', '.')
ELSE nested_0.PI2016 END, 1, 1, 0) AS PI2016,
nested_0.country AS country,
CONVERT_TO_INTEGER("join_rank_pi.csv".isonum, 1, 1, 0) AS isonum, "join_rank_pi.csv".isocode AS isocode, CONVERT_TO_INTEGER("join_rank_pi.csv".rank_PI2007, 1, 1, 0) AS rank_PI2007, CONVERT_TO_INTEGER("join_rank_pi.csv".rank_PI2008, 1, 1, 0) AS rank_PI2008, CONVERT_TO_INTEGER("join_rank_pi.csv".rank_PI2009, 1, 1, 0) AS rank_PI2009, CONVERT_TO_INTEGER("join_rank_pi.csv".rank_PI2010, 1, 1, 0) AS rank_PI2010, CONVERT_TO_INTEGER("join_rank_pi.csv".rank_PI2011, 1, 1, 0) AS rank_PI2011, CONVERT_TO_INTEGER("join_rank_pi.csv".rank_PI2012, 1, 1, 0) AS rank_PI2012, CONVERT_TO_INTEGER("join_rank_pi.csv".rank_PI2013, 1, 1, 0) AS rank_PI2013, CONVERT_TO_INTEGER("join_rank_pi.csv".rank_PI2014, 1, 1, 0) AS rank_PI2014, CONVERT_TO_INTEGER("join_rank_pi.csv".rank_PI2015, 1, 1, 0) AS rank_PI2015, CONVERT_TO_INTEGER("join_rank_pi.csv".rank_PI2016, 1, 1, 0) AS rank_PI2016
FROM (
 SELECT country, PI2007, PI2008, PI2009, PI2010, PI2011, PI2012, PI2013, PI2014, PI2015, PI2016
 FROM blob_storage.prosperitycontainer."pi.csv"
) nested_0
INNER JOIN blob_storage.prosperitycontainer."rank_pi.csv" AS "join_rank_pi.csv" ON nested_0.country = "join_rank_pi.csv".country
Let’s now connect Qlik Sense and Dremio to analyze the data further.
Dremio and Qlik Sense connection
Before the connection, you should previously open Qlik Sense Desktop. After that, press a button with an arrow near the Tableau and pick Qlik Sense:

Fill in your Dremio account password and click Continue:

Wait until the connection is established. You should see similar instructions after that:

We will work with Qlik Sense in the browser. Follow the link in #1, and you will see the next pop-up window. Click Open.

You will see automatically generated script:

Dremio supports DirectQuery technology. This means that the Qlik Sense Desktop actually doesn’t import any data from Dremio. It just communicates with Dremio with the help of queries. So, there can be a lot of queries. The main advantage of this approach is that when the data on the source is changed, these changes will be automatically reflected in Qlik Sense. No additional import statements are required. By the way, if you are familiar with the notion of physical and virtual datasets in Dremio, you can say that the DirectQuery technology is somewhat similar to this concept. Indeed, virtual datasets also don’t require data copying. They are completely defined by the set of transformations and other actions needed to their creation in the state in which they are at the moment.
However, we need to change the query a little bit. Add PI2007, …, PI2017 to Dimensions:

Click the Load data button at the top right corner of the screen and wait until the data is prepared successfully.
Data visualization in Qlik Sense
Let’s now prepare some data visualizations in Qlik Sense. Firstly, go to App overview:

On the next window, click Edit:

Now we can start building visualizations. On the left side of the screen, you can see the menu where all available charts are presented. The columns of your dataset are listed in the Fields section.

We want to start with a map. Drag and drop it to the sheet. Then, drag Country field to the map, and select it as an Area layer:

We set Color by measure and selected PI2016 as a measure (see the image below). This option should show different countries in different colors on the map depending on the value of PI2016 field.

Also, we have chosen Diverging classes (instead of Diverging gradient) color scheme. We did this because we wanted to show different countries by completely different colors instead of just by the shade of one color. This is what we have as a result:

We can see that countries with a high level of prosperity index (for example, Western and Northern Europe, USA, Canada, Australia) have red colors on the map, while the countries with low prosperity index are shown in blue colors.
Now, let’s see the distribution of PI2007 and PI2016. To do this, choose the Histograms option from the list of available visualizations and then select PI2007 and PI2016 as fields respectively.

Also, we have changed the bar width under the Histogram setting menu. Firstly, we turned off the Auto option. Then, we set the**_ Bar width (x-axis)_ ** :

So, you can see that there have been no significant changes in the distribution for over 10 years. We can note only a few changes.
First of all, probably there is a general increase in the prosperity index over most countries. We can conclude this by looking at the highest bar which was shifted to the right in 2016, and also by looking at the right side of the distribution where we can notice that more countries formed the rightmost bar in 2016 compared to 2007.
The second change we have noticed is that there are more countries with an extremely low level of prosperity index in 2016 compared to 2007. While we think that the average prosperity index becomes higher, the actual state of the world is that the inequality between wealthy and poor countries has increased.
Conclusion
In this tutorial, we have demonstrated how to analyze data from Azure Blob Storage in Qlik Sense with the help of Dremio as the intermediary. Dremio was used not only as the place where we store the data before it goes to Qlik Sense but also as an instrument for initial data preparation and processing. In Qlik Sense, we created several data visualizations just to show that everything is working as expected.
Try Dremio’s Interactive Demo
Explore this interactive demo and see how Dremio's Intelligent Lakehouse enables Agentic AI