Dremio supports complex data types like JSON and parquet with features for handling arrays and structs.
To demonstrate, the blog uses a sample dataset, running test queries and showing how to manipulate data effectively.
Users can flatten arrays using the FLATTEN() function or expand them into separate columns for clarity.
The blog outlines expanding structs and provides SQL examples for extracting specific columns.
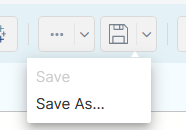
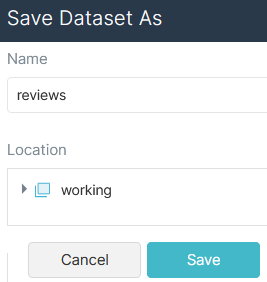
The final dataset can be saved as a Virtual Data Set, enabling easier access and processing, such as Iceberg table creation.
Try Dremio’s Interactive Demo
Explore this interactive demo and see how Dremio's Intelligent Lakehouse enables Agentic AI
Overview
Dremio provides out-of-the-box methods of handling complex data types in, for example JSON and parquet datasets. Common characteristics are embedded “columns within columns” and “rows within columns”.
In this blog, we will demonstrate how Dremio can discover and handle these types of data. The examples have been tested on the following Dremio versions:
23.1
25.2.18
26.0.5
Preparation of Example Dataset
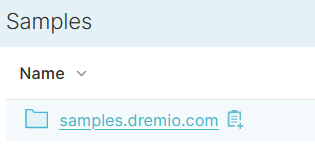
We will use the “Samples” dataset which is available to any Dremio environment.
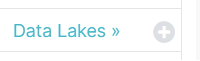
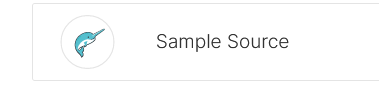
Add the Sample data source
Click on the + symbol next to Data Lakes
Add the sample source
After the source has been added, click on samples.dremio.com
Click on Dremio University
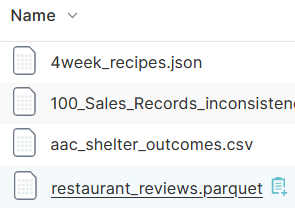
Scroll down the list of files, and click on restaurant_reviews.parquet
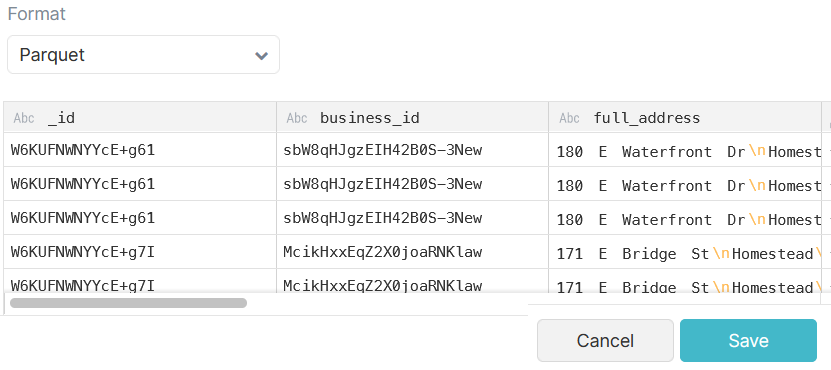
Click “Save” to promote the Restaurant Reviews parquet file as a PDS (Promoted Data Set).
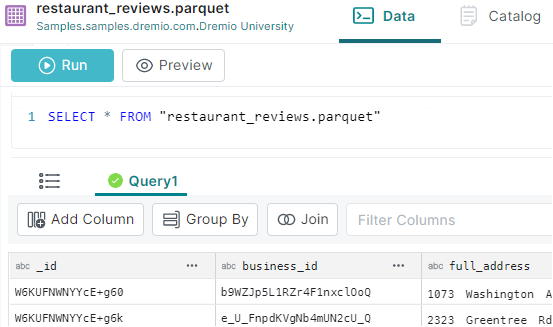
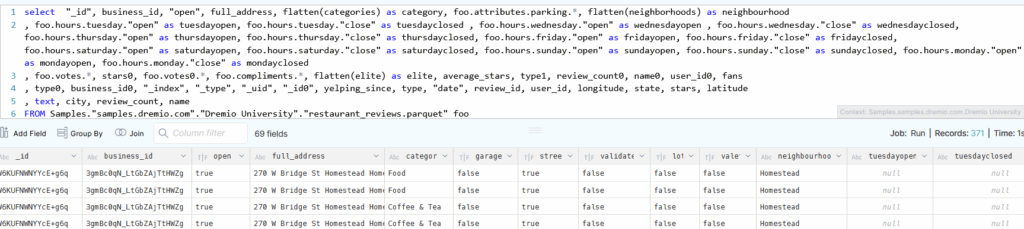
Run a test query against the sample source
We will run the SQL examples from the resultant “SQL Editor”, e.g.
SELECT *
FROM Samples."samples.dremio.com"."Dremio University"."restaurant_reviews.parquet" foo
Handling Arrays and Structs in Dremio
Handling Arrays in Dremio
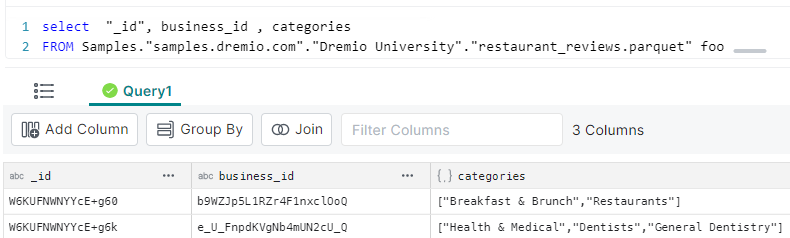
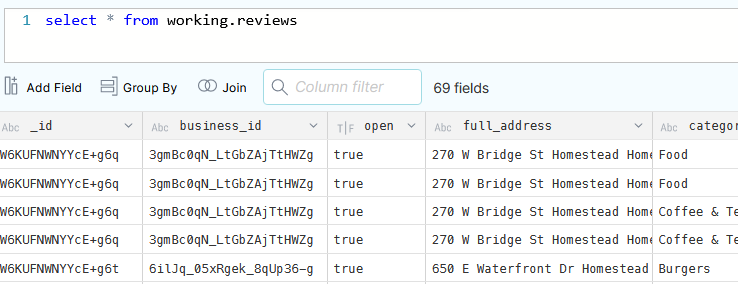
Run the following query to see an example array:
SELECT  "_id", business_id , categories
FROM Samples."samples.dremio.com"."Dremio University"."restaurant_reviews.parquet" foo
Here, we are retrieving 3 columns. Note that the “categories” column is an array :
(as denoted by the icon)
Let’s use this column for further analysis.
Flatten an Array
Arrays can be flattened using the SQL FLATTEN() function.
Run the following SQL command:
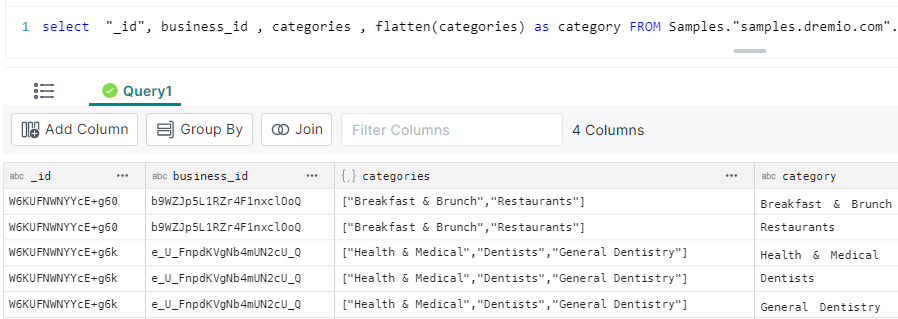
select  "_id", business_id
, categories
, flatten(categories) as category
FROM Samples."samples.dremio.com"."Dremio University"."restaurant_reviews.parquet" foo;
The result shows:
As previously we see the unflattened array (the “categories” column)
Also, each entry of that array has been flattened into a column (“category”); each array entry listed on separate rows, e.g. “_id” value ‘W6KUFNWNYYcE+g60’ has 2 entries in the results, one row per category
Expanding an Array
Alternatively, the array can be expanded along the single row, e.g. run the following SQL command:
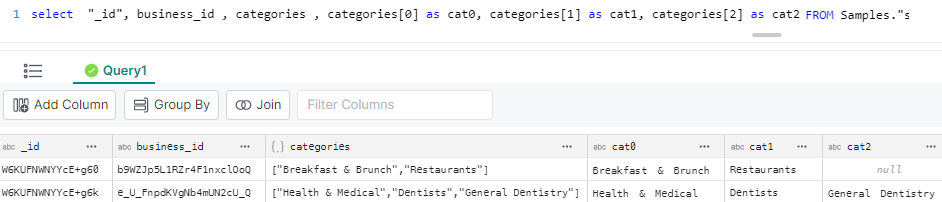
SELECT  "_id", business_id
, categories
, categories[0] as cat0
, categories[1] as cat1
, categories[2] as cat2
FROM Samples."samples.dremio.com"."Dremio University"."restaurant_reviews.parquet";
The result shows:
The unflattened array (the “categories” column)
The first 3 array entries have been flattened into other columns on the same row (cat0, cat1, cat2).
Handling Structs in Dremio
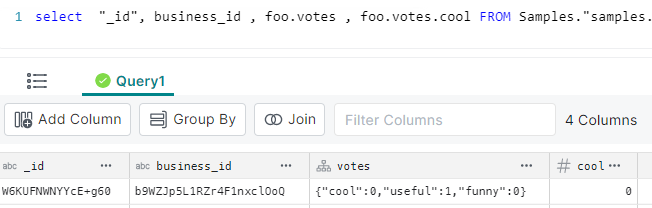
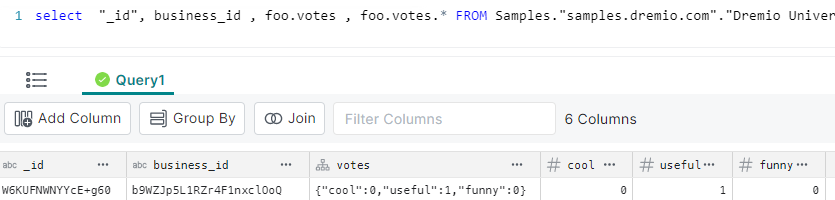
Run the following query to see an example struct:
select  "_id", business_id
, votes
FROM Samples."samples.dremio.com"."Dremio University"."restaurant_reviews.parquet";
Note that the “votes” column is a struct (as denoted by the icon)
Expanding a struct
We can extract an individual column by name, e.g. to extract the “cool” column from the struct:
Ingesting Data Into Apache Iceberg Tables with Dremio: A Unified Path to Iceberg
By unifying data from diverse sources, simplifying data operations, and providing powerful tools for data management, Dremio stands out as a comprehensive solution for modern data needs. Whether you are a data engineer, business analyst, or data scientist, harnessing the combined power of Dremio and Apache Iceberg will undoubtedly be a valuable asset in your data management toolkit.
Sep 22, 2023·Dremio Blog: Open Data Insights
Intro to Dremio, Nessie, and Apache Iceberg on Your Laptop
We're always looking for ways to better handle and save money on our data. That's why the "data lakehouse" is becoming so popular. It offers a mix of the flexibility of data lakes and the ease of use and performance of data warehouses. The goal? Make data handling easier and cheaper. So, how do we […]
Oct 12, 2023·Product Insights from the Dremio Blog
Table-Driven Access Policies Using Subqueries
This blog helps you learn about table-driven access policies in Dremio Cloud and Dremio Software v24.1+.