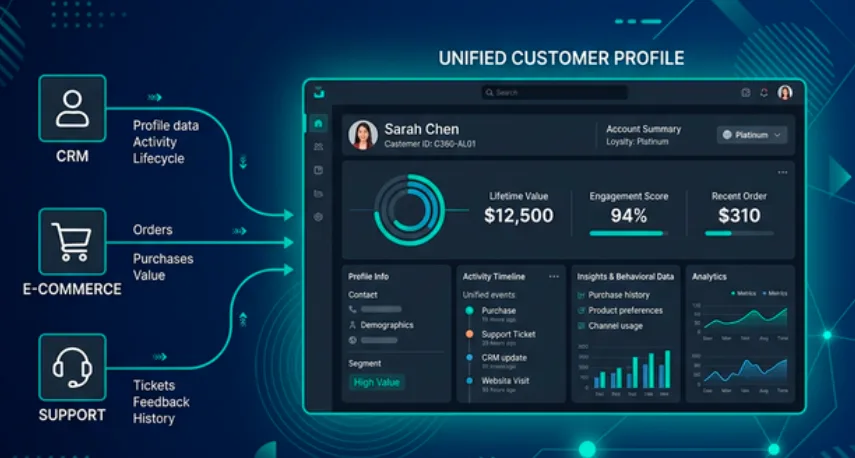
A unified customer view is one of the most requested analytics projects in any organization. Customer data sits in the CRM. Purchase history lives in the e-commerce database. Support tickets are stored somewhere else entirely. No single team sees the full picture.
This tutorial walks you through building a complete Customer 360 view on Dremio Cloud, from signup to asking natural language questions about your customers. You'll seed sample data, model it through Bronze, Silver, and Gold views, enable AI-generated documentation, and use Dremio's built-in AI Agent to generate insights and charts. The entire process takes about 30 minutes with a free trial account.
What You'll Build
By the end of this tutorial, you'll have:
Source tables simulating a CRM (PostgreSQL), an e-commerce platform (MySQL), and a support system (MongoDB)
Bronze views that clean and standardize raw data
Silver views that join customer records with purchases and support tickets
Gold views with business metrics like customer lifetime value and customer health score
AI-generated wikis and tags that teach the AI Agent what each metric means
Natural language analytics powered by the AI Agent
Try Dremio’s Interactive Demo
Explore this interactive demo and see how Dremio's Intelligent Lakehouse enables Agentic AI
Step 1: Sign Up for Dremio Cloud
Go to dremio.com/get-started and create a free trial account. The trial gives you 30 days and $400 in compute credits.
When you log in, you'll land on the homepage with the AI Agent chat box. Your trial comes pre-configured with:
A project (your analytics workspace)
An Open Catalog built on Apache Polaris (your built-in data catalog)
Dremio-managed storage (no need to connect your own S3 bucket)
You don't need to connect any external data sources to follow this tutorial. Everything runs inside the built-in catalog.
Navigate to the SQL Runner using the left sidebar. This is where you'll execute all the SQL in this tutorial.
Step 2: Create Folders and Seed Data
First, create a folder structure that simulates different source systems. In a production environment, these would be federated connections to actual databases. Here, we're using folders to organize the data the same way it would look with real sources.
CREATE FOLDER IF NOT EXISTS customer360exp;
CREATE FOLDER IF NOT EXISTS customer360exp.postgres;
CREATE FOLDER IF NOT EXISTS customer360exp.mysql;
CREATE FOLDER IF NOT EXISTS customer360exp.mongo;
Note: Because these tables live in the built-in Open Catalog, you reference them as folder.subfolder.table_name without a catalog prefix. When you connect external sources (PostgreSQL, S3, Snowflake), you'd use source_name.schema.table_name.
Now seed the tables. Each table has 50+ records to give the AI Agent enough data to generate meaningful analytics.
Every table you just created is stored as an Apache Iceberg table in Dremio's Open Catalog. This isn't just a storage choice. It directly affects the performance and reliability of your analytics.
Automated Performance Management. Dremio automatically maintains your Iceberg tables in the background. It compacts small files into larger, optimized ones (targeting 256 MB per file), rewrites manifest metadata for faster reads, clusters related records together, and vacuums obsolete data. You don't configure this. It happens automatically for every Iceberg table in the Open Catalog.
Results Cache. When you or the AI Agent run the same query more than once, Dremio returns the result from cache instead of re-executing the query. For a Customer 360 dashboard where certain views get hit repeatedly, this means sub-second responses without any additional configuration.
Autonomous Reflections. After your views start receiving queries, Dremio analyzes the access patterns over a 7-day window and automatically creates pre-computed materializations called Reflections. These are stored as Iceberg tables and the query optimizer substitutes them transparently. A query that used to scan millions of rows instead reads a pre-aggregated Reflection and returns in milliseconds. No DBA involvement required.
Iceberg vs. Federated: When to Use Which
In this tutorial, all source tables are Iceberg because they live in the Open Catalog. In production, the decision is more nuanced.
Keep data federated when real-time freshness matters. Your CRM's PostgreSQL database updates customer records throughout the day. If you replicate that data into Iceberg via an ETL pipeline, you introduce latency. Every pipeline has a schedule, and between runs your analytics are working with stale data. By querying PostgreSQL directly through Dremio's federation, you always see the latest record. You can still accelerate those federated queries by creating manual Reflections on the federated views. Dremio will pre-compute and cache the results, and you control the refresh schedule to balance performance against freshness.
Migrate data to Iceberg when you need Dremio's automated performance management. Iceberg tables in the Open Catalog get automatic compaction, manifest optimization, clustering, and vacuuming. They also qualify for Autonomous Reflections, where Dremio creates and manages Reflections without any manual setup. Historical data, aggregated reporting tables, and analytical datasets that don't need sub-minute freshness are strong candidates for Iceberg.
The practical approach: start with federation for all sources so you can query immediately. Then identify which datasets are queried most heavily or have the biggest performance gap, and migrate those to Iceberg tables in the Open Catalog. You get the best of both worlds: real-time access to operational data and automated optimization for analytical workloads.
Step 3: Build Bronze Views (Raw Layer)
Bronze views are the foundation of the medallion architecture. Their job is to create a clean, consistent interface over your raw source tables without changing the underlying data. Why bother? Because source systems use inconsistent conventions. Your CRM might store dates as DATE, your e-commerce system might use a different timezone, and your support tool might name its status column differently. Bronze views normalize these differences so that every downstream view works with a predictable schema.
In a production environment with real federated sources, Bronze views also serve as an abstraction layer. If you swap out your CRM vendor, you update one Bronze view instead of rewriting every Silver and Gold view that depends on it.
First, create the folders for each layer:
CREATE FOLDER IF NOT EXISTS customer360exp.bronze;
CREATE FOLDER IF NOT EXISTS customer360exp.silver;
CREATE FOLDER IF NOT EXISTS customer360exp.gold;
This view standardizes the customer table by casting the signup date to a TIMESTAMP type. This ensures consistent date handling when we join with orders and tickets downstream.
CREATE VIEW customer360exp.bronze.crm_customers AS
SELECT
  customer_id,
  first_name,
  last_name,
  email,
  segment,
  region,
  CAST(signup_date AS TIMESTAMP) AS signup_timestamp
FROM customer360exp.postgres.customers;
This view renames status to order_status to avoid ambiguity when we later join with the tickets table (which also has a status column). The date cast keeps timestamp types consistent.
CREATE VIEW customer360exp.bronze.ecomm_orders AS
SELECT
  order_id,
  customer_id,
  CAST(order_date AS TIMESTAMP) AS order_timestamp,
  total_amount,
  status AS order_status
FROM customer360exp.mysql.orders;
The tickets view renames status to ticket_status and casts both dates. The resolved_date can be NULL for open tickets, which we'll use later to calculate resolution time and identify unresolved issues.
CREATE VIEW customer360exp.bronze.support_tickets AS
SELECT
  ticket_id,
  customer_id,
  CAST(created_date AS TIMESTAMP) AS created_timestamp,
  CAST(resolved_date AS TIMESTAMP) AS resolved_timestamp,
  priority,
  status AS ticket_status,
  category
FROM customer360exp.mongo.tickets;
Step 4: Build Silver Views (Business Layer)
Silver views join data across sources and apply business logic. This is where the Customer 360 starts taking shape. Each Silver view answers a specific analytical question by combining data that previously lived in separate systems.
Customer Purchase Summary
This view joins customer profiles with their order history to answer: "How much has each customer spent, how frequently do they buy, and when did they last order?" The LEFT JOIN ensures customers with zero orders still appear in the results. Without this, you'd have blind spots in your Customer 360 for new customers who haven't purchased yet.
CREATE VIEW customer360exp.silver.customer_purchases AS
SELECT
  c.customer_id,
  c.first_name,
  c.last_name,
  c.segment,
  c.region,
  COUNT(o.order_id) AS total_orders,
  COALESCE(SUM(o.total_amount), 0) AS total_spent,
  COALESCE(AVG(o.total_amount), 0) AS avg_order_value,
  MAX(o.order_timestamp) AS last_order_date
FROM customer360exp.bronze.crm_customers c
LEFT JOIN customer360exp.bronze.ecomm_orders o ON c.customer_id = o.customer_id
GROUP BY c.customer_id, c.first_name, c.last_name, c.segment, c.region;
Customer Support Summary
This view calculates each customer's support footprint: total tickets, open tickets, high-priority escalations, and average resolution time. We use TIMESTAMPDIFF to compute resolution hours only for resolved tickets (where resolved_timestamp is not NULL). This metric is critical for the Gold layer's health score because a customer with high spend but multiple unresolved tickets is a churn risk.
CREATE VIEW customer360exp.silver.customer_support AS
SELECT
  c.customer_id,
  c.first_name,
  c.last_name,
  COUNT(t.ticket_id) AS total_tickets,
  SUM(CASE WHEN t.ticket_status = 'open' THEN 1 ELSE 0 END) AS open_tickets,
  SUM(CASE WHEN t.priority IN ('high', 'critical') THEN 1 ELSE 0 END) AS high_priority_tickets,
  AVG(CASE WHEN t.resolved_timestamp IS NOT NULL
    THEN TIMESTAMPDIFF(HOUR, t.created_timestamp, t.resolved_timestamp)
    ELSE NULL END) AS avg_resolution_hours
FROM customer360exp.bronze.crm_customers c
LEFT JOIN customer360exp.bronze.support_tickets t ON c.customer_id = t.customer_id
GROUP BY c.customer_id, c.first_name, c.last_name;
Step 5: Build Gold Views (Application Layer)
Gold views are the final, AI-ready datasets. They combine Silver views into the specific metrics that business users and the AI Agent will query directly. Each Gold view is designed to answer a category of business questions without requiring the user to understand the underlying joins or logic.
Customer Lifetime Value
This view combines purchase and support data into a single customer profile with a value_tier classification. The tier logic uses total spend thresholds: Platinum ($5,000+), Gold ($2,000+), Silver ($500+), and Bronze (under $500). This tiering lets sales and account teams prioritize outreach. The AI Agent can answer questions like "show me all Platinum customers in APAC" because the tier is pre-calculated in the view rather than requiring complex SQL at query time.
CREATE VIEW customer360exp.gold.customer_lifetime_value AS
SELECT
  p.customer_id,
  p.first_name || ' ' || p.last_name AS customer_name,
  p.segment,
  p.region,
  p.total_orders,
  p.total_spent,
  p.avg_order_value,
  p.last_order_date,
  s.total_tickets,
  s.open_tickets,
  CASE
    WHEN p.total_spent >= 5000 THEN 'Platinum'
    WHEN p.total_spent >= 2000 THEN 'Gold'
    WHEN p.total_spent >= 500 THEN 'Silver'
    ELSE 'Bronze'
  END AS value_tier
FROM customer360exp.silver.customer_purchases p
JOIN customer360exp.silver.customer_support s ON p.customer_id = s.customer_id;
Customer Health Score
This view classifies customers into health categories (At Risk, Needs Attention, Healthy, Stable) by combining spending behavior with support ticket patterns. A customer is "At Risk" when they have 2+ open tickets including at least one high-priority escalation, regardless of how much they spend. This is the view a customer success team would monitor daily to prevent churn. It answers: "Which valuable customers are having a bad experience right now?"
CREATE VIEW customer360exp.gold.customer_health_score AS
SELECT
  p.customer_id,
  p.first_name || ' ' || p.last_name AS customer_name,
  p.segment,
  p.region,
  p.total_spent,
  p.total_orders,
  s.open_tickets,
  s.high_priority_tickets,
  s.avg_resolution_hours,
  CASE
    WHEN s.open_tickets >= 2 AND s.high_priority_tickets >= 1 THEN 'At Risk'
    WHEN s.open_tickets >= 1 OR p.total_orders <= 1 THEN 'Needs Attention'
    WHEN p.total_spent >= 2000 AND s.open_tickets = 0 THEN 'Healthy'
    ELSE 'Stable'
  END AS health_status
FROM customer360exp.silver.customer_purchases p
JOIN customer360exp.silver.customer_support s ON p.customer_id = s.customer_id;
Step 6: Enable AI-Generated Wikis and Tags
The Gold views contain the right data, but the AI Agent needs to understand what each column and metric means in business terms. Dremio's AI Semantic Layer provides this context.
Click Admin in the left sidebar, then go to Project Settings.
Select the Preferences tab.
Scroll to the AI section and enable Generate Wikis and Labels.
Go to the Catalog and navigate to your Gold views under customer360exp.gold.
Click the Edit button (pencil icon) next to the desired view.
In the Details tab, find the Wiki section and click Generate Wiki. Do the same for the Tags section by clicking Generate Tags.
Repeat for each Gold view.
Dremio's generative AI samples the view schema and data to produce descriptions like: "customer_lifetime_value: Contains one row per customer with their name, segment, region, total purchase history, support ticket counts, and a value tier classification (Platinum/Gold/Silver/Bronze) based on total spend."
Review the generated content and refine it. If you want to enhance the wiki with additional business context, copy the generated output into the AI Agent on the homepage and ask it to produce an improved version in a markdown code block. For example, you might ask the Agent to add details like "Platinum tier customers represent our top 5% by revenue and qualify for dedicated account management." Copy the Agent's output and paste it back into the wiki editor.
These wikis and labels are not decorative. They are the context that Dremio's AI Agent reads before generating SQL. Better metadata produces more accurate responses.
Step 7: Ask Questions with the AI Agent
Go to the Homepage and use the AI Agent chat box. Try these prompts:
"Who are the top 10 customers by total lifetime spend?"
The Agent will query customer360exp.gold.customer_lifetime_value, sort by total_spent, and return a ranked list. It uses the wiki context to understand that "lifetime spend" maps to the total_spent column.
"Show me a bar chart of average order value by customer segment."
The Agent generates the SQL, runs it, and renders a chart directly in the console. Enterprise customers will likely show higher average order values than SMB.
"Which customers are At Risk and have spent more than $3,000?"
This query uses the customer360exp.gold.customer_health_score view. The Agent understands "At Risk" is a value in the health_status column because the wiki describes the classification logic.
"Create a chart showing open support tickets by region and priority."
The Agent joins the necessary data and generates a grouped bar chart. This kind of cross-dimensional analysis would normally require a BI developer to build a dashboard. With the semantic layer in place, a business user can ask for it in plain English.
Next Steps
This tutorial used folders to simulate federated sources, but the same architecture works with real, live data:
Connect real sources. Add your PostgreSQL, MySQL, Snowflake, or S3 storage as federated sources. Dremio queries them in place without copying data.
Add access control. Apply Fine-Grained Access Control (FGAC) policies to mask PII like email addresses for non-admin users.
Connect BI tools. Use Arrow Flight SQL (JDBC/ODBC) to connect Tableau, Power BI, or Looker to your Gold views.
Scale with Autonomous Reflections. Once query patterns stabilize, Dremio automatically creates Reflections to accelerate the most common queries. You don't need to configure anything.
The Customer 360 view you built here is a working foundation. Replace the sample data with your own sources, and you have a governed, AI-ready analytics layer over your actual customer data.
Ingesting Data Into Apache Iceberg Tables with Dremio: A Unified Path to Iceberg
By unifying data from diverse sources, simplifying data operations, and providing powerful tools for data management, Dremio stands out as a comprehensive solution for modern data needs. Whether you are a data engineer, business analyst, or data scientist, harnessing the combined power of Dremio and Apache Iceberg will undoubtedly be a valuable asset in your data management toolkit.
Oct 12, 2023·Product Insights from the Dremio Blog
Table-Driven Access Policies Using Subqueries
This blog helps you learn about table-driven access policies in Dremio Cloud and Dremio Software v24.1+.
Aug 31, 2023·Dremio Blog: News Highlights
Dremio Arctic is Now Your Data Lakehouse Catalog in Dremio Cloud
Dremio Arctic bring new features to Dremio Cloud, including Apache Iceberg table optimization and Data as Code.