8 minute read · March 26, 2018
Trump Twitter Sentiment Analysis: How I Did It
Introduction
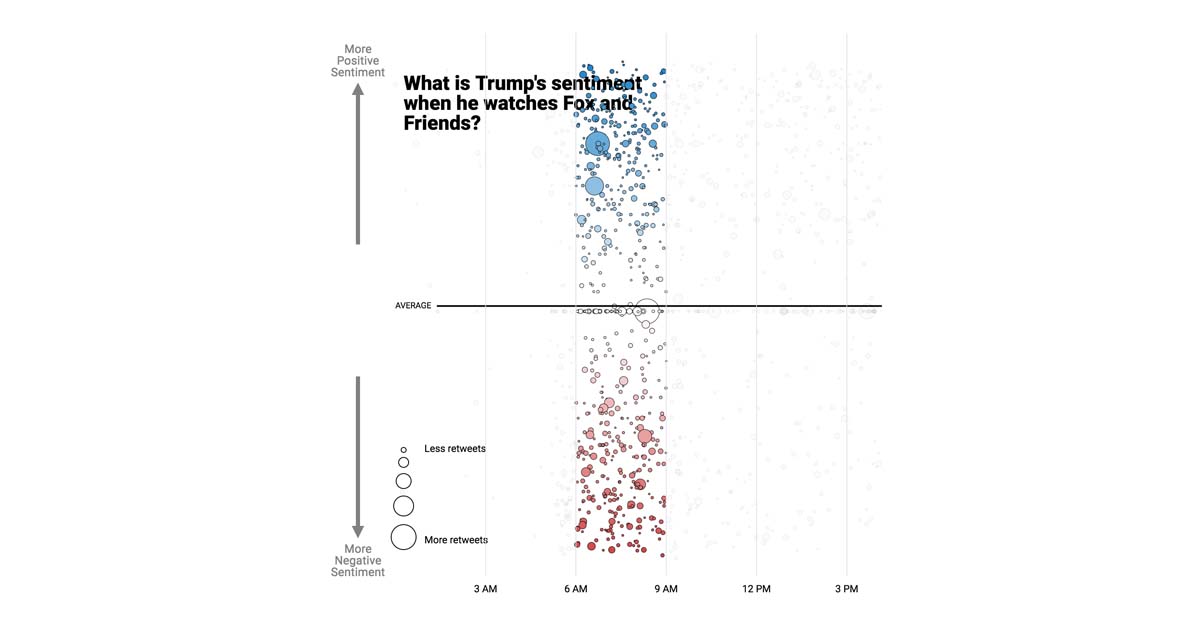
With Dremio, you can easily create visualizations from your data by either exporting your data into a BI tool like Tableau, exporting your data in JSON or CSV format, or opening a direct ODBC connection to the Dremio server. Here, I’ve used Dremio to perform a sentiment analysis of all of Trump’s tweets from the Trump Twitter Archive and to perform a sentiment analysis on his most retweeted tweets. Then, I used d3.js to create this visualization.
Data curation in Dremio
First, I downloaded and unzipped all of the condensed data from the Trump Twitter Archive. Then, I uploaded the data to Dremio.
The date_created string is a jumbled in the raw data, so I extracted it from the column into a new column.
Then, I converted the new column into a time type using the format string HH24:MI:SS.
Then, I extracted the date from the date_created column, and concatenated the date and year strings.
After I have my date column, I can convert it into a date type. I used the format string MON DD YYYY.
Because I want analyze Tweets that are his own words, I filtered out all tweets that begin with RT or “.
I also want to strip punctuation from the text column before I perform the sentiment analysis to clean my data.
Now, I can perform the sentiment analysis. I can split the text column by “ “, turning the text column into an array, and then I can unnest the array, giving each token its own row.
Before I join my sentiment dictionary, I want to lowercase all my words so they can be matched properly.
I’ve downloaded the AFINN txt file, which is a list of words with a matching sentiment score. You can download the file here. You’ll want to upload the text file with a tab delimiter. Then, I can join the AFINN data with the words in the tweets on the text column.
You’ll need to convert sentiment to an integer before you can sum all of the sentiment scores.
Now, each row has a sentiment score as an integer, and you can aggregate each tweet by using the Group By function and summing over sentiment.

Finally, I filtered for Trump’s most retweeted tweets using the Keep Only function.
You can also use the SQL Editor to write custom SQL queries. My final SQL query before I visualized my data looked like this:
SELECT nested_3.source AS source, nested_3.id_str AS id_str, nested_3.date_created AS date_created, nested_3.time_created AS time_created, nested_3.retweet_count AS retweet_count, nested_3.favorite_count AS favorite_count, nested_3.is_retweet AS is_retweet, nested_3.in_reply_to_user_id_str AS in_reply_to_user_id_str, SUM(CONVERT_TO_INTEGER(join_afinn.B, 1, 1, 0)) AS Sum_sentiment
FROM (
  SELECT source, id_str, LOWER("text") AS text, date_created, time_created, retweet_count, favorite_count, is_retweet, in_reply_to_user_id_str
  FROM (
    SELECT source, id_str, flatten(regexp_split(CASE WHEN regexp_like(text, '.*?[.,\/#!$%\^&\*;:{}=\-_`~()].*?') THEN regexp_replace(text, '[.,\/#!$%\^&\*;:{}=\-_`~()]', '') ELSE text END, '\Q \E', 'ALL', 30)) AS text, TO_DATE(date_created, 'MON DD YYYY', 1) AS date_created, time_created, retweet_count, favorite_count, is_retweet, in_reply_to_user_id_str
    FROM (
      SELECT source, id_str, text, year_created, CONCAT("date_created", ' ', "year_created") AS date_created, time_created, retweet_count, favorite_count, is_retweet, in_reply_to_user_id_str
      FROM (
        SELECT source, id_str, text, created_at, extract_pattern(created_at, '\d+', 5, 'INDEX') AS year_created, CASE WHEN length(substr(created_at, 5, 6)) > 0 THEN substr(created_at, 5, 6) ELSE NULL END AS date_created, TO_TIME(CASE WHEN length(substr(created_at, 12, 8)) > 0 THEN substr(created_at, 12, 8) ELSE NULL END, 'HH24:MI:SS', 1) AS time_created, retweet_count, favorite_count, is_retweet, in_reply_to_user_id_str
        FROM "@elbert".trumptweets.condensed_2018
      ) nested_0
    ) nested_1
  ) nested_2
) nested_3
 INNER JOIN "@elbert".trumptweets.afinn AS join_afinn ON nested_3.text = join_afinn.A
 WHERE 15000 <= nested_3.retweet_count
GROUP BY nested_3.source, nested_3.id_str, nested_3.date_created, nested_3.time_created, nested_3.retweet_count, nested_3.favorite_count, nested_3.is_retweet, nested_3.in_reply_to_user_id_str
Scrollytelling in D3
D3.js is Mike Bostock’s JavaScript library for creating interactive data visualizations for the web. To create the beeswarm visualization of tweets, I used this block as a template. 
I then linked each tweet on mouseover by using the tweet id and embedding the tweet.

Then, I used Jim Valladingham’s So You Want to Build a Scroller tutorial and D3 transitions to create the scrolling animations.
You can learn more about how to use Dremio with D3 in this tutorial.
Additional Resources

BLOG
Ingesting Data Into Apache Iceberg Tables with Dremio: A Unified Path to Iceberg
By unifying data from diverse sources, simplifying data operations, and providing powerful tools for data management, Dremio stands out as a comprehensive solution for modern data needs. Whether you are a data engineer, business analyst, or data scientist, harnessing the combined power of Dremio and Apache Iceberg will undoubtedly be a valuable asset in your data management toolkit.
Dremio Blog: Product Insights,
Learn More ->

BLOG
Table-Driven Access Policies Using Subqueries
This blog helps you learn about table-driven access policies in Dremio Cloud and Dremio Software v24.1+.
Dremio Blog: Product Insights,
Learn More ->

BLOG
Kubernetes Autoscaling in Dremio 24.3
Dremio Blog: Product Insights,
Learn More ->